|
|
| Home - Software M&A Review - May 04 Issue |
Software M&A – Q1 Software Industry Equity Report |
By Ken Bender, Managing Director, and Allen Cinzori, Vice President - Software Equity Group, LLC
A comprehensive review and analysis of the past quarter’s software industry mergers and acquisitions, this report analyzes changing market valuations of public software companies as a group, as well as by product category. The Report also includes detailed data and in-depth analysis of M&A transactions during the quarter, including changes in the most active software product categories, continued improvement in M&A valuations, further transition in deal structure and form of payment, and shifts in buyer priorities and thinking. Also listed are Q1’s most active buyers and insight into some of Q1’s most interesting and instructive deals.
ECONOMY
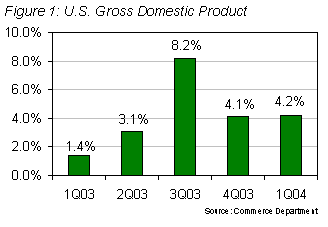
By almost every measure, the U.S. economy continued to improve in the first quarter. Gross Domestic Product rose at a 4.2% annual rate, up from the 4.1% pace in 4Q03 (Figure 1). However, the growth rate was lower than the 5% rate some economists had expected. According to the Wall Street Journal, economists now predict the economy will grow 4% or more in 2004 and Q1’s GDP report supported those expectations.
The Conference Board’s composite index of leading economic indicators, a key short term forecast, improved again in March by 0.3%. During the same period, coincident indicators increased 0.2% and lagging indicators fell by 0.1%.
Consumer confidence remained strong through the close of the quarter. Growing concerns about Iraq and skyrocketing gasoline prices did not negate the positive effects of low mortgage rates and vehicle manufacturer discounts.
Although March also saw a long-awaited improvement in employment, with non-farm employees increasing by 308,000, the unemployment rate held steady at about 5.7%. While the media has identified outsourcing as the primary culprit, most economists disagree. Only 16% of 55 economists surveyed by The Wall Street Journal identified outsourcing as a significant factor. While an estimated total of 58.6 million layoffs took place in the U.S. between 2001 and 2003, only 690,000 jobs were lost through relocation to overseas markets.
PUBLIC MARKETS
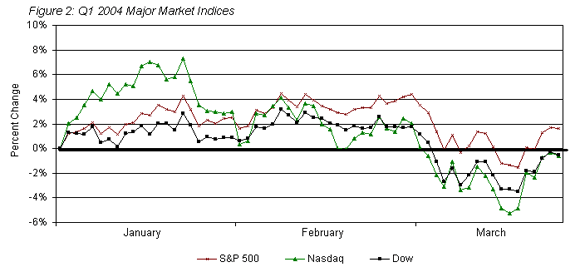
The stock market charted an uneven course in the first three months of 2004, but gave up little ground. Early Q1 saw the Dow, Nasdaq and S&P 500 increase as much as 3.2%, 7.3% and 4.5%, respectively over their January 1 opening, but drop as low as (1.6%), (5.2%) and (3.5%) during a major sell-off (Figure 2). Some last minute buying at the end of the quarter stabilized these same indices, resulting in close of quarter percent changes of (0.5%), (0.6%) and 1.6%. Nevertheless the Dow, Nasdaq and S&P 500 closed up 30%, 49% and 33%, respectively, from the end of 1Q03.
As of January, our public software company index known as the SEG-70 (comprised of 70 companies in nine major software product categories) has been expanded to 108 companies in 17 principal categories (the SEG-100) to enable more detailed tracking of industry performance and trends. New product categories include:
Enterprise System Management
Financial Software
Healthcare Software
Internet Tools/Utilities
Manufacturing Software
Middleware
Operating Systems
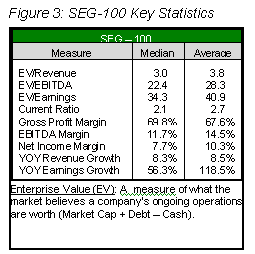
SEG-100 valuations improved markedly in the first quarter. The Median EV/Revenue ratio for the SEG-100, a key indicator, reached 3.0x, while median EV/EBITDA and EV/Earnings for those companies posting profits increased to 22.4x and 34.3x (Figure 3). The median current ratio, measured as current assets divided by current liabilities, an indication of a company’s liquidity, was a healthy 2.1.
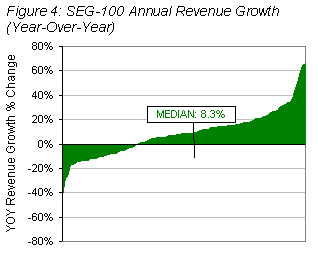
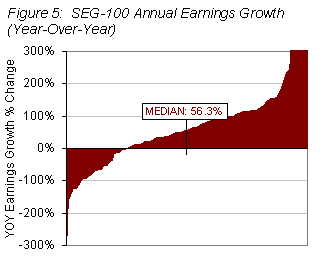
The escalating market caps and higher EV/Earnings ratio are partially attributable to improved financial performance. Aided by stronger demand and continued cost-cutting efforts, median annual revenue of the SEG-100 rose 8.3% between 1Q04 and 1Q03 (Figure 4), while median earnings grew an impressive 56.3% over the same period (Figure 5).
Continuing the trend we first observed in 3Q03, U.S. markets in 1Q04 continued to favor those software companies with the largest revenues (Figure 6). As a measure of market value, the 21 companies in the SEG-100 with revenue greater than $1 billion averaged a 4.5x EV/Revenue multiple, as compared to a 2.5x multiple for companies with revenue less than $1 billion. Expectedly, those public software companies posting profits in Q1 were rewarded with a 3.3x revenue multiple valuation, as contrasted with non-profitable companies which had a median 2.6x multiple.


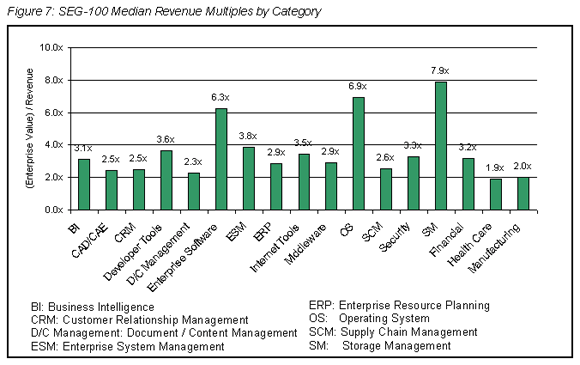
Market valuations for public software companies also varied widely by target market and product category. Valuations for most categories peaked in January, but ended the quarter relatively unchanged. The SEG-100 median revenue multiples by principal product category for Q1 are enumerated in Figure 7.
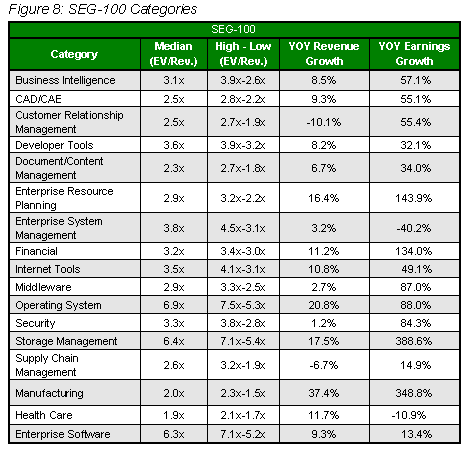
Publicly traded operating system software developers, led by Microsoft, boasted the highest valuation among all categories at 6.9x trailing revenue, (Figure 8). Storage Management software developers posted a 1Q04 revenue multiple of 6.4x and a median year-over-year revenue growth rate of 17.5%, along with year-over-year earnings growth of 388.6%. The manufacturing vertical showed impressive 37.4% year-over-year revenue growth, but that did little to improve valuation. Manufacturing posted a revenue multiple of 2.0x, second lowest among all SEG-100 product categories. Customer relationship management
(CRM) and supply chain management (SCM) were the laggards in terms of year-over-year revenue growth, posting losses of 10.1% and 6.7%, respectively.
MERGERS & ACQUISITIONS: THE TRENDS
In order to discern trends in merger and acquisition activity, it is essential to understand changes in buyer thinking. Precisely what motivated the buyer to acquire this particular company; to spend cash, dilute equity, allocate precious resources and assume sometimes formidable risks? What were the deal drivers in Q1, how were they different from 2003 and how did they impact valuations and purchase prices?
An improved economy, respectable revenue growth, solid earnings and soaring public market valuations spurred a growing number of public and venture-backed private companies to pursue acquisitions in the first quarter of 2004. In our view, however, the uptick in M&A activity and M&A valuations is most attributable to projected increases in corporate IT spending. In the software industry, stronger demand by enterprise customers translates quickly to fierce competition among software providers. In virtually every enterprise software product category, larger companies turned to strategic acquisitions to competitively differentiate their offerings. As a result, both software industry M&A activity and median valuations increased again in 1Q04.
Despite the higher price tags, buyers were undeterred, showing a resolve not seen since the bubble days. The number of transactions with multiples of 5 times trailing twelve months (TTM) or higher climbed sharply. Even a few private equity firms chose to compete aggressively with strategic buyers for best-of-breed technologies. And while no one is quite ready to declare a new bull market in M&A, there are indications we’re moving in that direction.
PRODUCT EXTENSION
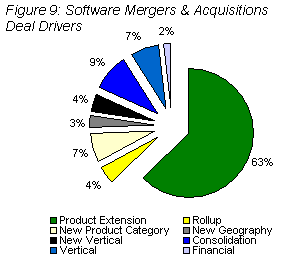
A deal-by-deal analysis of some 182 transactions we analyzed in 1Q04 reveals 63% of the buyers, primarily public software companies, sought to enhance their current product suite by acquiring small and mid-cap companies targeting the same markets with highly complementary, best-of-breed, market proven products and technology (Figure 9). The objective was to better satisfy market requirements and thereby differentiate from the competition and create new sources of revenue. Examples abound, including Verity’s acquisition of both Cardiff Software and NativeMinds to provide a more comprehensive, single source, user friendly solution (see deal write-ups that follow). Hewlett Packard made three acquisitions in Q1 (Novadigm, Consera, and Trulogica) to extend the capabilities of its OpenView suite. JDA Software, a leading retail enterprise software provider, acquired Timera, a developer of workforce management solutions to bring a broader complement of products to its target market. Intellisync acquired Search Software, whose software manages personal identity data in enterprises and network databases. These product extension buys were roughly the same percentage of 1Q04 total transactions as in 4Q03.
NEW MARKETS
Last quarter we noted a surprising number of buyers who had ventured far from home, acquiring software companies in new product categories and new markets in an effort to accelerate growth. The trend slowed in the first quarter of 2004, with buyers acquiring new product categories and markets, comprised of some 15% of all software M&A transactions, compared to approximately 25% in 4Q03. New market buyers in Q1 included corporate computer system reseller Agilysys which acquired Inter-American Data (IAD), a software provider serving the gaming and casino market. Captiva Software, a provider of input management solutions, acquired ADP Context, developer of automated health care claims processing software. Convergys, a Cincinnati Bell spin-off that’s now a $2.3B global provider of outsourced customer billing and HR services, acquired DigitalThink, a provider of e-learning to the Fortune 1000.
VERTICAL MARKETS
Vertical market software company acquisitions comprised about 8% of M&A transactions in Q1, led by five deals in the healthcare sector. Healthcare software company acquirers were among the few remaining bargain hunters, seeking to capitalize on valuations which remain depressed due to stagnant healthcare IT spending and escalating industry cost pressures. Q1 also saw software acquisitions in the manufacturing, legal, education and energy sectors. Q1 saw a growing number of mobile content delivery and wireless software transactions, particularly in vertical markets. Look for a growing number of mobile content and wireless software transactions during the remainder of the year.
TRENDS FORECAST
While software industry M&A activity in the first quarter was nearly identical to 2003’s average, we anticipate merger and acquisition activity to ramp in the remaining three quarters, exceeding 2003’s total (1,325 transactions) by about 12%. Principal acquisition targets will continue to be best-of-breed software companies which functionally enhance the offerings of larger public companies or which extend them into new product categories and geographical markets; software companies which extend leverage buyers in the small/medium business market; and software companies in key vertical sectors such as healthcare, government, defense and finance.
MERGERS AND ACQUISITIONS: THE NUMBERS
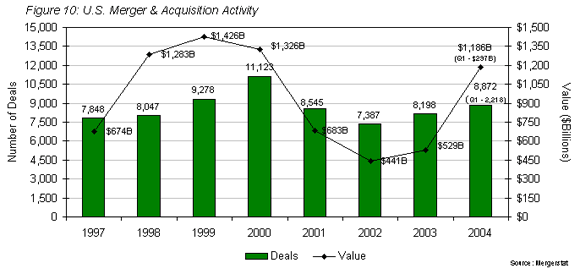
The momentum of 2003’s U.S. merger and acquisition activity continued to build in the first quarter of 2004. Domestic M&A activity across all industry sectors in Q1 2004 totaled 2,218 deals with an aggregate purchase price of $297 billion (Figure 10). While the total number of deals in Q1 declined 8% from Q4 2003, total M&A dollars for the first quarter is up 140% from Q4 2003, already 56% of 2003’s total.
Software mergers and acquisitions continued to lead all other industry sectors with 387 deals, up slightly from deal totals in Q3 and Q4 of 2003 (Figure 11). In terms of M&A dollars spent, the $12.6 billion spent on software company acquisitions in Q1 was up 7.7% from Q4 2003 and 4.1% from Q3 2003 (Figure 12). Internet tools/utilities transactions were partly responsible for the surge in M&A spending. Ask Jeeves / Interactive Search Holdings, Yahoo / Kelkoo, InfoSpace / Switchboard and Convergys / DigitalThink each had large price tags reflecting hefty multiples (See deal write-ups). Two mega-deals, Juniper / Netscreen and (Bain Capital, Silverlake, Wargurg Pincus) / UGS PLM totaled $5.5 billion and represented 44% of total U.S. software M&A dollars paid in Q1.
|
|


|

