|
|
| Home - Software M&A Review - Nov 04 Issue |
Software M&A - Insights |
By Ken Bender, Managing Director, and Allen Cinzori, Vice President - Software Equity Group, LLC
ECONOMY
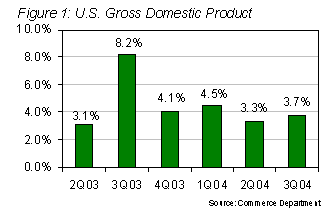
The U.S. economy showed continued growth in the third quarter, but signals were once again mixed. GDP growth, the broadest measure of economic activity, was revised downward to 3.3% for 2Q04. The preliminary 3Q04 GDP number inched up to 3.7%, showing little improvement despite statements by Fed officials that the economy gained traction after hitting a "soft patch" in late Spring. While some economists are predicting a GDP of 4% or better in 4Q04, soaring oil prices, auto manufacturer reliance on costly incentives to spur sales, declines in consumer confidence and spending, disappointing hiring figures and recent increases in initial unemployment insurance claims, could signal slower growth in coming quarters.
Oil prices exceeding $50 a barrel weighed heavily on stock prices, with investors fearing high energy costs would negatively impact corporate earnings. Despite spiraling energy and health care costs, inflation remains at an annualized rate of 2% to 3%, but the Fed, seeking to be proactive, will almost certainly raise the federal funds rate again at its November 10th FOMC meeting, this time from 1.75% to 2.0%. The rate is still well below most estimates of equilibrium.
An average 204,000 new jobs a month were added from January to June, but U.S. job growth slowed in September as manufacturers, airlines and retailers shed workers. September was the fourth straight month fewer than 150,000 new jobs were created, the threshold many economists estimate is necessary to absorb a growing labor force and maintain the jobless rate. Although only 96,000 non-farm jobs were added in September, far fewer than the 128,000 created in August, the unemployment rate held steady at 5.4%.
The Conference Board's index of leading economic indicators, which forecasts the economy's likely performance over the next three to six months, fell in August by 0.3%, the third consecutive monthly decline. Most economists believe the decline represents a minor correction that does not signal an end to the economic recovery which began in March 2003. The Board's index of coincident indicators, a gauge of current economic activity, increased 0.2% in August and 0.2% in July. During the six month period through August, the coincident index has increased 1.3%.
PUBLIC MARKETS
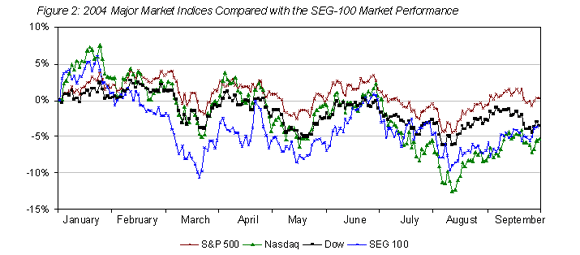
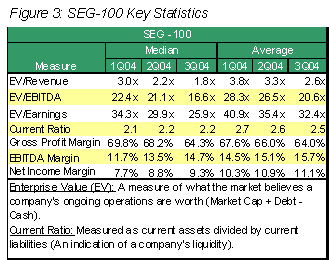
Major market indexes moved in unison, rising in August and early September, but declining as the quarter ended (Figure 2). Overall, the S&P 500 fared better than the Dow and NASDAQ. The S&P declined a modest 2.3% this quarter but was still up 0.2% for the year. The Dow and NASDAQ posted declines of 3.4% and 7.4%, respectively, for the quarter, and have declined 3.6% and 5.3%, respectively, year to date. Stock prices of most public software companies declined in July, after several high profile vendors missed their second quarter revenue and earnings forecasts. Veritas, Sybase, Siebel, BMC, JDA, Computer Associates, Peoplesoft and Compuware all came in under analysts" consensus projections, shaking investor confidence in the software sector . The SEG 100, our composite index of publicly traded software companies, performed poorly most of the quarter and closed 3Q04 down 0.04% (down 3.7% year-to-date), despite a September rally. Other key financial performance measures for the SEG-100 are enumerated in Figure 3.
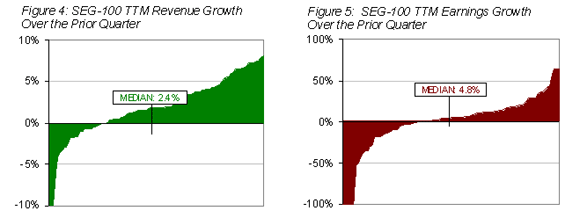
On a trailing-twelve-month (TTM) revenue basis, overall financial performance of the SEG-100 improved. Median TTM revenue increased 2.4% in 3Q04 compared to 2Q04, while TTM earnings increased 4.8% over the same period (Figures 4 and 5). Software companies with subscription-based revenue components, including Computer Associates, Symantec, Mercury Interactive and McAfee, turned in stronger performances. We continue to see subscription-based revenue as key to profitability and earnings growth.
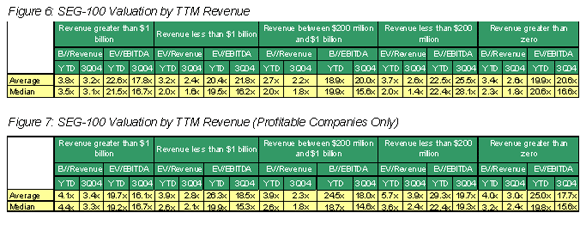
Size continues to matter in the software industry. For the quarter, SEG-100 companies with revenues greater than $1 billion posted a median EV/Revenue ratio of 3.1x, compared to a median ratio of 1.6x for software companies with less than $1 billion in revenue (Figure 6). Profitability also continues to matter (Figure 7). The median EV/Revenue multiple for software companies posting a profit in 3Q04 was 2.4x, but only 1.4x for those reporting losses.
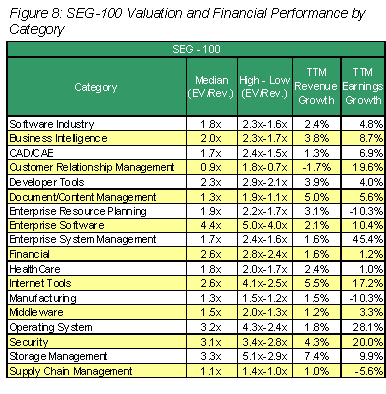
Every software product category in the SEG-100, with the exception of CRM, showed TTM revenue growth, led by storage management (+7.4%) and Internet tools (+5.5%). As for earnings, enterprise systems management vendors led all other categories, reporting an average TTM earnings increase of 45.4%, while enterprise resource planning and manufacturing software both declined 10.3% in median TTM earnings
(Figure 8).
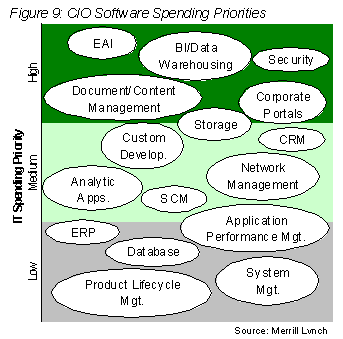
IT spending remains one of the most important bellwethers of software company financial performance. According to a Goldman Sachs August IT spending survey of CIOs, IT budgets (hardware, software and services) have been essentially flat year-to-date but should increase in 4Q04. For 2005, 45% of the CIOs surveyed are predicting their overall IT budgets will increase an average of 1.8%. Their highest software priorities were security, wireless LAN connectivity, VPN, web-application software and enterprise portal software.
Merrill Lynch's August 2004 software spending survey showed CIOs almost split among those expecting reduced IT spending and those anticipating a back-end loaded September and a healthy 4Q04 IT budget flush. Top spending priorities for the group were application integration, BI/data warehousing, security, document/content management and corporate portals (Figure 9). About 65% or Merrill Lynch's respondents indicate that software consumes between 10%-30% of their IT budget. Both the Goldman Sachs and Merrill Lynch surveys are predicting robust IT budget increases in the December timeframe.
INITIAL PUBLIC OFFERINGS
An active third quarter for new issues ensured 2004 will be the best year for IPOs since 2000. New issues held steady in the third quarter and are expected to maintain that pace in the fourth quarter thanks to a strong pipeline. According to Thomson Financial, 63 companies went public in 3Q04, raising a total of $13.3 billion. That compares to 58 IPOs and $9.5 billion in 2Q04. For comparison purposes, 21 companies went public in 3Q03 raising an aggregate $4.2 billion. The largest deal this quarter was online-search company Google, which raised $1.8 billion in its auction style IPO. Software IPOs in 3Q04 included Cogent (biometric hardware/software), NAVTEQ (navigation software), RightNow (CRM), Blackbaud (non-profit vertical software) and Phase Forward (clinical trials software) (Figure 10).

MERGERS & ACQUISITIONS: THE TRENDS
Consolidation is a familiar term in the software industry, but the intended meaning varies. Narrowly viewed, it connotes the buyout of a software company by a larger industry player, primarily to gain market share and eliminate a competitor. Oracle's attempt to acquire Peoplesoft is a classic example, but it's not representative of the sort of competitor buyouts taking place in 2004. More frequently, smaller public companies, seeking to bulk up in order to compete with the behemoths (software companies with market caps greater than $1 billion), acquired similarly-sized competitors to achieve scale. In 3Q04, competitor buyouts rose 5.4% over 2Q04. Art Technology Group's acquisition of Primus (online commerce software) provides a good example of a challenger buying a peer to gain market share and improve earnings by combining operations and cutting costs.
From a broader software industry perspective, consolidation is simply a combining together of software companies for reasons financial, strategic or otherwise. The question we wrestle with daily is what specific buyer motives prompted those combinations? Our Trends section this quarter looks at software industry consolidation, driving forces and misconceptions.
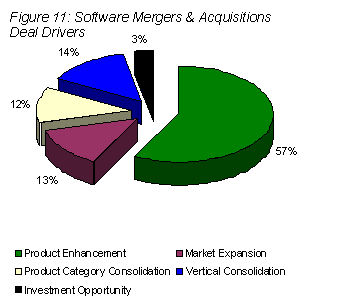
For the past three years, better than four out of five software industry mergers and acquisitions can be characterized as product enhancement acquisitions or market extension acquisitions. We've defined both terms repeatedly in prior issues of our Report. What we have not emphasized previously, however, is the extraordinary degree to which these M&A deal drivers are intertwined.
According to our analysis, some 13% of 3Q04 transactions were market extension plays, with buyers acquiring their way into new vertical markets, new geography, or new software categories (Figure 11). Examples include Cognos" acquisition of Swedish enterprise performance management provider Frango; Vision HRM's acquisition of not-for-profit vertical software provider Serenic; and business intelligence provider Datawatch's purchase of content management solution Mergence. One year ago, in 4Q03, such market extension buys comprised almost 20% of all acquisitions. Has there been a change in buyer thinking, or is there a different phenomenon at work here?
We used to think relatively "safe" product enhancement deals and more "risky" market extension deals reflected very different buyer mentalities and they unquestionably do, for some buyers. But upon closer examination, it appears the ebb and flow of these deal types are related and far more predictable than one might imagine. Today's market extension buyer will likely become tomorrow's product enhancement buyer, as it seeks to flesh out and differentiate its offering in the new product category or territory. Thereafter, the same buyer will likely seek, once again, to extend into a new market. It's a dynamic process which accounts for the vast majority of today's software mergers and acquisitions.
Underlying these acquisitions is a phenomenon we call "Category Creep". It plays out it in any number of ways. Sometimes it takes the form of a "roll-up", the aggregation and integration of separate, well-established product categories. Historical examples abound. In the pre-Y2K era, Financial (Oracle), HR (Peoplesoft) and manufacturing (SAP) software application vendors, hungrily eyeing each others" turf, convinced the Fortune 1000 that fully integrated systems from the same vendor were essential. Dozens of software industry acquisitions soon followed, as those and other vendors scurried to acquire missing components and redefine themselves as full ERP providers.
Sometimes category creep occurs when an industry behemoth, unable to extract from its current market the revenue growth demanded by industry analysts and investors, annexes the leader of an adjacent product category and, in the process, redefines itself and its product category. Take EMC - the storage management behemoth - which acquired Documentum, the leading document management company and transposed itself into the leading provider of "Information Lifecycle Management" solutions, a new super category.
More often, category creep is driven by a mid-cap public software company, usually a leader in a particular product category. Typically, such a pure-play company will have superb technology, strong brand recognition, a sizable customer base, cash on its balance sheet and fierce competitors. Ironically, such success breeds discontent (i.e., "Why aren't we capitalizing more on our strengths?"). What better way to do so then evolve the current product line into a new product category that adds new functionality and capabilities which vastly improve end user productivity, ROI, etc., etc. For an example, look no further than Business Intelligence. Cognos, anxious to differentiate from its fierce rivals Business Objects, Informatica and Hyperion, acquired Adaytum, a financial analytic applications provider, and a new product category- Business Performance Management - was born. Smelling upgrade revenue and not to be outdone, financial analytic app provider Hyperion merged with Arbor (OLAP), and shortly thereafter acquired Brio (query and reporting). Not to be outdone, Business Objects acquired Acta to add data integration functionality essential for business performance management.
Business Intelligence is hardly an isolated example of product category creep. It wasn't so long ago sales automation developers and help desk application vendors consolidated to form customer relationship management, and document management software providers added object and data management to create the content management category. Today engineering design automation developers are expanding by acquisition into product lifecycle management; systems integrators and enterprise application integration providers are morphing into middleware and web services; and application development platform providers have moved aggressively into configuration management, change management, IT asset management and business technology optimization. And acquisitions are the preferred route to these new destinations.
Once a software company has moved into the new product category, or created a new product category, it will then execute one or more product enhancement acquisitions to flesh out and differentiate its new offering. Take Mercury Interactive, the respected leader in testing and analyzing the performance of enterprise and web-based applications. In June 2003 it acquired Kintana, a $44M provider of products that help automate and streamline key processes critical for IT organizations, and made it the cornerstone of Mercury's Business Technology Optimization (BTO) vision. In July 2003, Mercury bought Allerez, a developer of IT real-time reports and analytics to enhance its BTO offering. Ten months later Mercury again expanded its new BTO division by buying Appilog, a developer of applications which model and pinpoint changes to a company's IT infrastructure.
Also contributing to product creep and consolidation is the rapidly growing number of financial buyers willing to pay "strategic buyer" multiples to acquire growing, highly profitable, best-of-breed "platform" companies that serve high opportunity markets. Once the platform is established, these financial buyers are acquiring companies to add incremental and differentiating functionality and extend the platform into new markets.
With all this "consolidation", one might conclude the number of software companies is significantly lower today than 6 years ago, but there's no data to support that. And with all of this consolidation, one might expect to see a steady decline in the number of software mergers and acquisitions, but the opposite is true. Some 500 more software companies will be acquired in 2004 than were acquired in 1998. How can that be?
The software industry has proven to be remarkably resilient, innovative and opportunistic. Although some have been declaring software to be a mature industry, there are, every year, a host of innovative products and cutting edge technologies from new entrants which make end users more productive, informed and insightful. Once they gain traction, customers, brand identity and profitability, they become viable consolidation candidates.
Some additional 3Q04 trends:
Vertical acquisitions were up 4% from 2Q04. Kintera acquired three more companies this quarter (BNW Software, KindMark, GivingCapital) to solidify its leadership of the non-profit market niche, after encountering increased competition from Blackbaud, which recently went public.
Most software deals have been friendly affairs, but that may change. Oracle vs. Peoplesoft wasn't the only hostile deal on the table. During the third quarter, CyberGuard made a run at its direct competitor Secure Computing, which was twice its size, but eventually accepted defeat after realizing its all-stock offer had no teeth. JDA's all-stock offer for QRS was challenged by an array of other suitors, including e-logistics provider Inovis and three financial buyers after JDA's stock price plummeted on poor 2Q04 performance. Inovis offered 16% more than JDA's initial offer (31% more than JDA's post-bid stock price) and prevailed. We predict sweetheart deals will continue to attract competing bids from private equity firms, which seem to be less inhibited by software industry valuations than in the past.
Security software remained the most active software product category from an M&A perspective, and will likely remain so in 4Q04. Among the security software vendors targeted and acquired in 3Q04 were Mailblocks (America Onlince, TurnTide (Symantec), Foundstone (McAfee), BugScan (LogicLibrary), PestPatrol (Computer Associates), and Omniva (Liquid Machines).
MERGERS AND ACQUISITIONS: THE NUMBERS
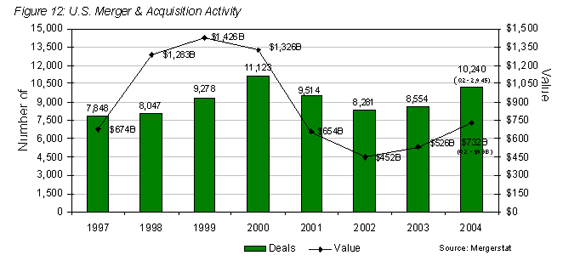
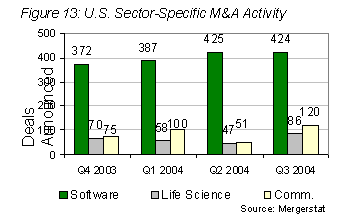
Across all industry sectors, there were 2,945 mergers and acquisitions in the U.S. during the third quarter, aggregating $99 billion (Figure 12). At the current run rate, overall domestic deal volume in 2004 will reach 10,240, outpacing 2003 by 20%, and aggregate transaction value will exceed $732 billion, a 39% increase over 2003. As in the prior two quarters, software continued to lead all other industry sectors with 424 transactions, which equates to approximately 14% of all U.S. M&A activity in 3Q04 (Figure 13). Acquirers spent $7.5 billion on software businesses in 3Q04, a second quarterly decline in M&A dollar volume when compared to the $12.6 billion expended in 1Q04. The first quarter, however, was heavily skewed by two multi-billion dollar mega-deals totaling more than $6 billion.
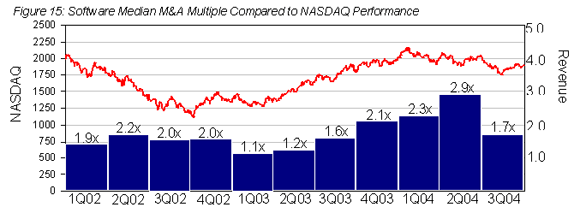
The most noteworthy M&A development in 3Q04 was a rather sharp reduction in median valuation, measured as a multiple of TTM revenue, breaking a streak of six consecutive quarter-over-quarter increases. The median software company M&A valuation (based on equity purchase price), was 1.7 times (TTM) revenue in 3Q04, an increase over 3Q03, but significantly lower than 2Q04. Still, the median (TTM) revenue multiple YTD stands at a very respectable 2.3x. We see 4Q04, and the first half of 2005, settling in at the 2.3x - 2.5x (TTM) range.
We attribute the valuation decline in 3Q04 to several factors: First, the TTM median valuation of 2.9, relative to 2.3 in 1Q04, was an aberration, in part attributable to a disproportionate number of product category creep/market extension deals with high multiples. Second, the third quarter saw the NASDAQ down some 13% in August before bouncing back to close the quarter down 7.4%, as noted in earlier sections of this Report. There is a consistently close correlation between NASDAQ performance and software industry M&A valuations and deal volume.
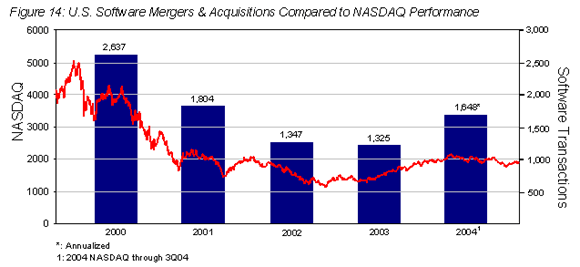
Figure 14 demonstrates how closely NASDAQ performance is aligned with North American software industry deal volume. Figure 15 shows a strong correlation between NASDAQ performance and M&A median valuations, but requires a bit more explanation. Median valuations peaked at about 5x (TTM) in early 2000, declined more precipitously than the NASDAQ composite, then leveled off as a result of fewer fire sales, lots of cash on buyer balance sheets, and a stubborn refusal by the relatively few remaining healthy sellers to exit for less than 2x. By 1Q03, valuations were once again tracking the NASDAQ, and the two indices have remained closely correlated through 3Q04.
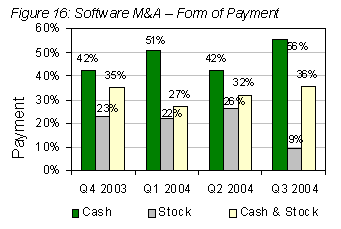
Declining stock prices have also impacted the use of cash vs. stock as deal currency (Figure 16). As a result of a floundering NASDAQ, stock-only deals were down in 3Q04 by 17% compared to the prior quarter. 56% of the deals in 3Q04 were cash only, up sharply from 42% of all transactions in 2Q04. The number of deals where a combination of cash and stock was used increased 4% increase from in the third quarter.
|
|


|

