|
|
| Home - Software M&A Review |
Software M&A - Q1 Software Industry Equity Report |
By Ken Bender, Managing Director, and Allen Cinzori, Vice President - Software Equity Group, LLC
Economy
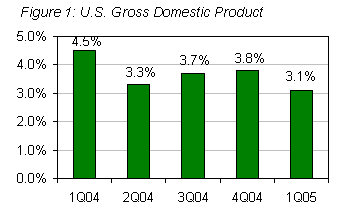
The U.S. economy continued to grow in the first quarter, but signals were once again mixed. GDP growth, the broadest measure of economic activity, was revised upward to 3.8% for 4Q04, capping the best year of growth since 1999 (Figure 1). However, the GDP number slipped to 3.1% for 1Q05, as once-indefatigable consumers strained against higher energy prices and climbing interest rates. Still, the International Monetary Fund projected the U.S. economic growth will average 3.6% this year, more than four times the pace in Japan and Germany, and the highest among the world’s leading industrialized nations.
Oil prices exceeding $50 a barrel weighed heavily on stock prices, with investors fearing high energy costs would negatively impact corporate earnings. To combat inflation, the Federal Reserve boosted the discount rates from 2.75% to 3.00% in May, the eighth such increase since last June. In doing so, the Fed once again displayed its relative satisfaction with economic growth and firm commitment to keep inflation in check.
Employment numbers for 1Q05 were friendly. From January to February nonfarm payrolls rose a solid 243,000 while March increased payrolls 110,000 over February. In March the number of unemployed persons decreased from 8 million in February to 7.7 million, and the unemployment rate decreased from 5.4% in February to 5.2%. In January, the total number of unemployed persons was 7.7 million and the unemployment rate was 5.2%.
The Conference Board’s index of leading economic indicators, which forecasts the economy’s likely performance over the next three to six months, fell 0.4% in March after posting a 0.1% gain in February and 0.3% decline in January. Most economists believe the economy is expanding, but at a slower and less predictable rate. The Board’s index of coincident indicators, a gauge of current economic activity, rose 0.2% in March.
Public Market and Public Software Company Performance
Following a volatile but ultimately positive 2004 in which the S&P 500 finished up 9% and the Dow and NASDAQ posted annual increases of 3.6% and 8.4%, respectively, the first quarter of 2005 was sobering. The Dow, NASDAQ and S&P 500 each posted Q1 declines (2.6%, 8.1%, and 2.6%, respectively) from their January 1 opening (Figure 2). Nevertheless, many viewed the declines as temporary, noting all three indexes have posted stellar returns since bottoming out in October 2002, with the Dow, NASDAQ and S&P 500 up 44%, 79% and 52%, respectively, as of the end of 1Q05.
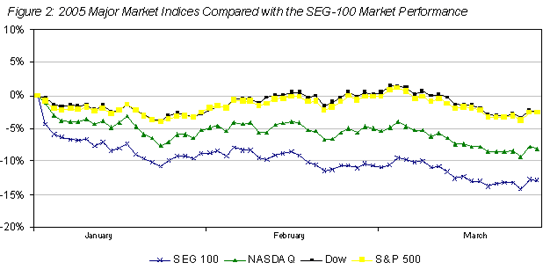
The software industry fared worse than other industry sectors in terms of Q1 stock performance. The market value of the SEG-100, our composite index of publicly traded software companies, lagged other market indexes throughout the first quarter, and closed down 12.9% (Figure 2). Key financial performance measures for the SEG-100 are enumerated in Figure 3.
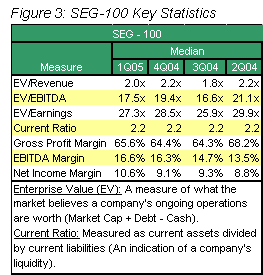
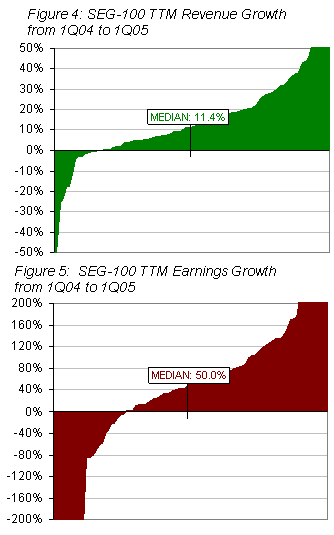
Median revenue of the SEG-100 increased a modest 11.0% between 1Q04 and 1Q05 (Figure 4). Profitability, however, grew a very impressive 50%, as software companies reaped the benefits of prior years’ cost cutting and recently implemented recurring revenue strategies. The median EBITDA margin of the SEG-100 grew from 11.7% in 1Q04 to 16.6% by 1Q05. Likewise, the median net income margin increased from 7.7% to 10.6% over the same period. Median earnings for the SEG-100 between 1Q04 and 1Q05 increased 50.0% (Figure 5).
As in the past, financial performance varied significantly by software product category (Figure 6).
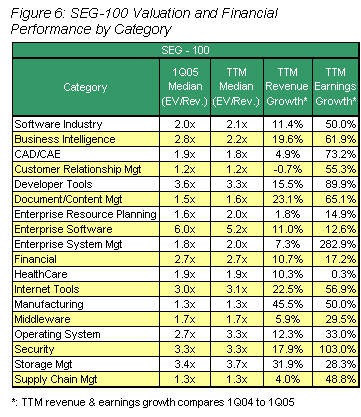
Manufacturing and Storage Management providers led all other software categories in 1Q05 revenue growth ( up 45.5% and 31.9%, respectively from a year ago), while Customer Relationship Management (-0.7%) and Enterprise Resource Planning providers (+1.8%) continued to lag far behind in revenue growth (Figure 8). On an earnings basis, enterprise systems management vendors led all other categories, reporting an average TTM earnings increase of 282.9%, while companies targeting the Health Care vertical increased only 0.3% in median TTM earnings.
Despite the marked improvement in earnings, investors remained concerned about the long term growth prospects of many software companies. Stock prices and market caps saw significant declines during the first quarter and were reflected in three key SEG-100 valuation metrics, Enterprise Value/Revenue, Enterprise Value/EBITDA, and Enterprise Value/Earnings, which declined 33.3%, 21.9%, and 20.4%, respectively, from the first quarter 2004.
For the remainder of 2005, we expect investors will continue to scrutinize the financial performance of public software companies more closely than in 2004, paying particular attention to topline growth. Public software companies that continue to grow revenue at rates equal to the industry median and continue to improve EBITDA margins may not be richly rewarded, but should see modest increases in their valuations. Those that disappoint - even a little - will likely draw immediate retribution from investors. And those that exceed expectations will likely be well-rewarded with share values that climb faster than the industry median.
Investor demand for topline growth has undoubtedly fueled software industry consolidation. Since1Q04, six SEG 100 software companies (Ascential, Mapics, Netegrity, Peoplesoft, SunGard, Retek) have been acquired, and we expect such consolidation will accelerate during the remainder of 2005.
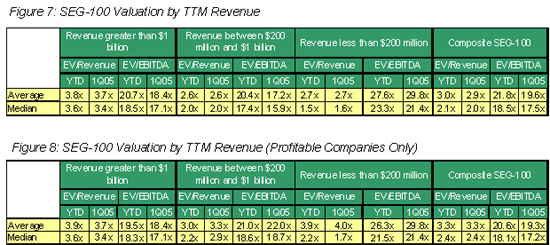
Also fueling consolidation is the premium the street places on size, with investors continuing to favor the software industry’s largest players. SEG-100 companies with revenues greater than $1 billion posted a 1Q05 median EV/Revenue ratio of 3.6x, compared to a median ratio of 2.1x for all software companies in our index (Figure 7). Profitability also continues to be a key measure of a public software company’s market valuation (Figure 8). The median EV/Revenue multiple for software companies posting a profit in 1Q05 was 2.4x, but only 1.5x for those reporting losses.
...more...
|
|


|

