|
|
| Home - Software M&A Review |
Software M&A - Q2 Review
continued... page 2 |
|
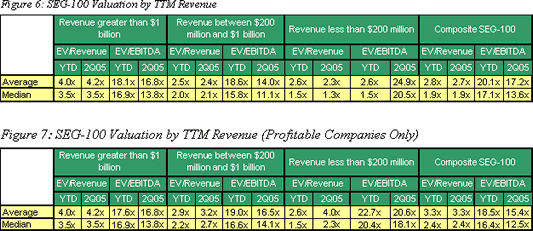
Virtually every software category experienced revenue and earnings growth in 2Q05. On a TTM basis, revenue growth was strongest in the manufacturing vertical (+41.6%) and Internet tools (+31.0%), with customer relationship management (-0.4%) and enterprise resource planning (-0.4%) lagging far behind. Enterprise system management providers, led by BMC and Novell, increased TTM earnings 295.8%, leading all categories, while supply chain management realized a modest 7.5% increase (Figure 6).

The markets continued to express confidence in the very largest software vendors (Figure 7). Companies with TTM revenue in excess of $1 billion posted a median 3.5x EV/Revenue ratio compared to a median 1.3x ratio for software companies with revenues less than $1 billion. Despite the renewed emphasis on revenue growth, investors continued to reward profitability. The median valuation of SEG-100 companies posting profits in 2Q05 was 2.4x, but only 1.1x for those reporting losses (Figure 8).
 Revenue growth for the balance of 2005 could be disappointing or encouraging, depending upon which IT spending forecast one relies. CIO Magazine's Tech PollTM, which surveys CIOs in a broad cross section of industries, projected a 6% increase in IT budgets in the coming 12 months. According to the survey, much of the spending will be focused on security (52.5%)
followed by storage (49.5%).
Goldman Sachs" June IT spending survey, which we've found to be most reliable, was less encouraging.
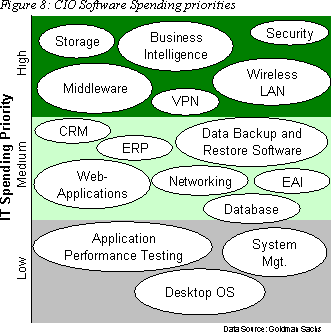
According to the survey, 2005 IT operating and capital budgets will grow 2.6% and 2.2%, respectively. Longer-term, CIOs are signaling a 4.2% increase in their IT spending. Business intelligence joined security and storage management as the highest spending priorities, according to the Goldman Sachs survey (Figure 8).
Software companies continued to eschew the lackluster IPO market, with many candidates favoring an M&A exit. SSA Global, a provider of enterprise software applications, was the lone industry IPO in 2Q05, and its experience only served to reaffirm the majority's decision to hold off or exit by acquisition. To garner greater investor interest and participation in the eleventh hour, SSA Global reduced the number and price of its shares and scratched a $100 million special dividend payment to its controlling stockholders. Issued on May 26th, the company priced 9 million shares at $11 in its debut. The company originally planned to sell 14.3 million shares at $13 to $15 each. The stock closed up 9% by the end of the quarter.

Mergers and Acquisitions: The Numbers
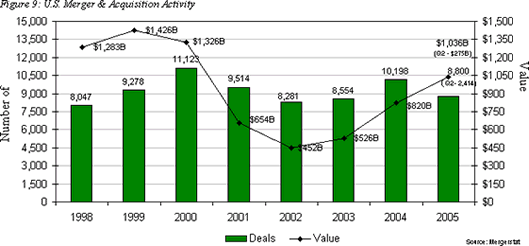
 U.S. 2Q05 merger and acquisition activity rebounded after a disappointing first quarter. Domestic M&A activity across all industry sectors in 2Q05 totaled 2,414 deals aggregating $275 billion (Figure 9). The total number of deals in 2Q05 increased 21.6% from 1Q05, while total M&A dollars for 2Q05 increased 13.2% from 1Q05. At the current run rate, 2005 U.S. M&A activity will increase 26.3% in aggregate dollar value, although deal volume will drop by 13.7% compared to 2004. U.S. 2Q05 merger and acquisition activity rebounded after a disappointing first quarter. Domestic M&A activity across all industry sectors in 2Q05 totaled 2,414 deals aggregating $275 billion (Figure 9). The total number of deals in 2Q05 increased 21.6% from 1Q05, while total M&A dollars for 2Q05 increased 13.2% from 1Q05. At the current run rate, 2005 U.S. M&A activity will increase 26.3% in aggregate dollar value, although deal volume will drop by 13.7% compared to 2004.
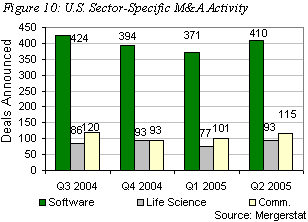
Software mergers and acquisitions continued to lead all other industry sectors with 410 transactions in 2Q05. Software M&A total deal volume increased 10.5% compared to 1Q05 (Figure 10). In terms of aggregate purchase price, $13.8 billion was spent on software company acquisitions in 2Q05, a decrease of 35.8% relative to 1Q05, which is primarily attributable to a dearth of mega-deals in this quarter (Figure 11). Last quarter's M&A spending total included Silver Lake, et. al./SunGard; InterActiveCorp/Ask Jeeves; and IBM/Ascential, which together aggregated $14 billion.
...more...

|
|


|

