|
|
| Home - Software M&A Review - Aug 06 Issue |
Software M&A - Q2 Review
continued... page 4 |
The total number of deals in 2Q06 increased 19.1% over 2Q05, while total M&A dollars increased 36.7% over the same time period.
 Software represented 15% of total M&A deal activity in 2Q06, leading all other industry sectors as in quarters past. There were 431 software transactions, a 5.1% increase over 2Q05 (Figure 15). Software represented 15% of total M&A deal activity in 2Q06, leading all other industry sectors as in quarters past. There were 431 software transactions, a 5.1% increase over 2Q05 (Figure 15).
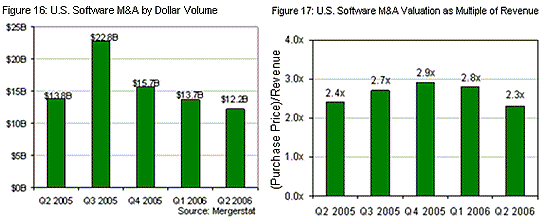
In terms of total M&A dollars spent, the software sector ended the quarter at $12.2 billion, aggregating $26 billion for the first half of the year (Figure 16). Though impressive, the software industry’s M&A dollar total trailed well behind first place communications, which represented $85 billion year to date (YTD). The median valuation of software industry M&A transactions (based on TTM revenue and the seller’s equity value) in 2Q06 was 2.3x, somewhat lower than both 2Q05 (2.4x) and 1Q06 (2.8x) (Figure 17).

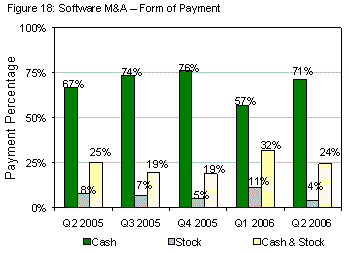
 Deal currency in 2Q06 strongly favored cash over stock, reflecting sellers’ growing uneasiness with an erratic stock market and buyers’ burgeoning cash reserves. All-cash deals represented 71% of 2Q06 software and technology sector M&A transactions, a 4% increase over the same quarter a year ago, while all-stock transactions comprised only 4% of 2Q06’s deals, down 7% from the prior quarter (Figure 18). Deal currency in 2Q06 strongly favored cash over stock, reflecting sellers’ growing uneasiness with an erratic stock market and buyers’ burgeoning cash reserves. All-cash deals represented 71% of 2Q06 software and technology sector M&A transactions, a 4% increase over the same quarter a year ago, while all-stock transactions comprised only 4% of 2Q06’s deals, down 7% from the prior quarter (Figure 18).
Almost 1 in 4 software M&A transactions in 2Q06 featured a combination of cash and stock, down 8% from 1Q06, but nearly identical to a year ago.
During the past two years, 34% of all acquirers were private equity and private company buyers, and this quarter proved no exception. In 2Q06, private buyers accounted for 33% of all software M&A transactions, an increase from 1Q06’s 31% and 2Q05’s 29% (Figure 19 and 20).

Venture capitalists, private equity firms, and venture-backed private companies were all quite active, occasionally paying public buyer strategic multiples to acquire private and public software companies that satisfied their investment criteria. More often, though, financial buyers sought to acquire software companies they could leverage with significant debt and advisory fees, a process politely known as dividend recapitalization. In most cases, the target markets were “platform” software companies with revenue of $100 million or more, significant and sustainable recurring revenue and profits, an entrenched, dominant and defensible market position, and a potential for rapid and sizable inorganic growth through tuck-in acquisitions.
 The software industry has long used median multiple of trailing twelve months (TTM) revenue to measure M&A valuations. We’ve been no exception, but for years we’ve cautioned against using the median deal multiple as anything other than a point of reference – and a misleading one, at that. In Figure 21, we dissect the median software company exit valuation for the first half of 2006 to provide greater insight into software company valuation. Our analysis considers the affect on valuation of equity structure (private vs. public company), target market, software product category, and size of buyer and seller. The software industry has long used median multiple of trailing twelve months (TTM) revenue to measure M&A valuations. We’ve been no exception, but for years we’ve cautioned against using the median deal multiple as anything other than a point of reference – and a misleading one, at that. In Figure 21, we dissect the median software company exit valuation for the first half of 2006 to provide greater insight into software company valuation. Our analysis considers the affect on valuation of equity structure (private vs. public company), target market, software product category, and size of buyer and seller.
As a first step, we separated public and private software company sellers to ascertain any disparity in exit valuation. Unsurprisingly, the disparity was significant. In 1H06, public company sellers accounted for 21% of all software M&A transactions and had a median exit valuation of 1.9x TTM revenue. During the same time period, private company sellers accounted for 79% of all transactions and commanded a median selling price of 3.0x TTM revenue.
Next, we segregated software company sellers specializing in vertical markets (e.g. retail, financial services, telecom, manufacturing, etc.) from those companies with horizontal software solutions. In 1H06, 27% of software company sellers were focused on a vertical market and yielded a median 2.7x TTM revenue valuation. Those sellers offering a horizontal solution represented 73% of sellers for the same period and commanded a nearly equivalent 2.8x TTM revenue valuation. Historically, horizontal software company valuations have been measurably higher than their vertical counterparts.
We also analyzed the exit valuations of infrastructure software companies as compared to enterprise application software companies. Application software companies represented 47% of all sellers and fetched a median M&A exit valuation of 2.5x, while infrastructure software companies represented 53% of sellers and commanded an exit valuation of 2.7x.
|
|

