|
|
| Home - Software M&A Review - Feb 03 Issue |
Software M&A: 2002 - A Year in Review
continued... page 2 |
Software companies Accpac International, Bentley Systems and Silicon Energy withdrew their planned IPOs in 2002. However, Accpac, a provider of business management software, did reregister late in the year. Accpac joins InterVideo, a provider of digital video and audio software, as a 2003 IPO candidate.
PRIVATE EQUITY
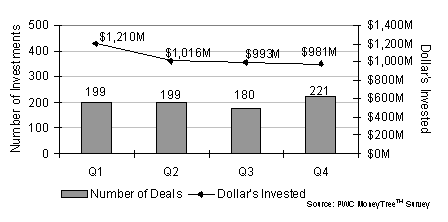
2002 U.S. venture capital investment returned to 1997 levels according to PricewaterhouseCoopers/ Venture Economics/National Venture Capital Association MoneyTreeTM Survey. For the year, the number of companies funded declined by 36% while dollars invested fell 49%, with $21.2B invested in 3,016 companies. This compares to $41.3B invested in 4,712 companies in 2001. The average investment fell 20%, to $7M.
Life sciences, which includes biotech and medical devices, received the lion’s share of VC funding, accounting for 22% of the total, or $4.7B. Up 13% from 2001, this was the only growth sector. Of the $4.7B invested, 57% went into biotech and the remainder into medical devices.
Software continued to be the industry sector attracting the most VC equity investment in 2002, with 799 companies funded (26% of the total). Relative to 2001, the number of software industry VC investments declined 20%. In dollar terms, $4.3B was invested in software businesses in 2002, compared to $8.1B in 2001 and $17.3B in 2000 (see Figure 4).
Figure 4: Software Industry VC Investments

2002 saw VC investment focus shift from early stage entities to more stable later stage companies. Thomson Venture Economics indicates that for every dollar invested in new financing in 2002, four dollars were invested in follow-on deals. In 1999, two and one-half dollars were invested in follow-on deals for every dollar of new financing. MoneyTreeTM reports that 19%, or $817M, of all VC dollars invested in 2002 went to early stage companies. 21% of the $817M went to early stage software companies within the software sector.
MERGERS & ACQUISITIONS
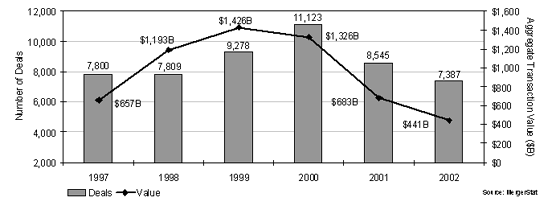
Figure 5: U.S. Merger & Acquisition Activity

2002 was a difficult year overall for M&A. MergerStat reported a total of 7,387 U.S. transactions for $441B, down from 8,545 deals for $683B in 2001. Transaction volume approximated 1997/1998 levels, while aggregate transaction value returned to 1993 levels (see Figure 5).
Weakness in the M&A market was largely attributable to declining equity markets, cautious debt markets and global uncertainty. Additionally, M&A was not a strategic priority in 2002, with many potential buyers focused on reducing costs and growing earnings in order to shore up declining stock prices. Public buyers were also increasingly conservative in the face of greater scrutiny from their shareholders. Many prospective sellers, in turn, have chosen to sit on the sidelines until the economy, capital markets and seller valuations improve.
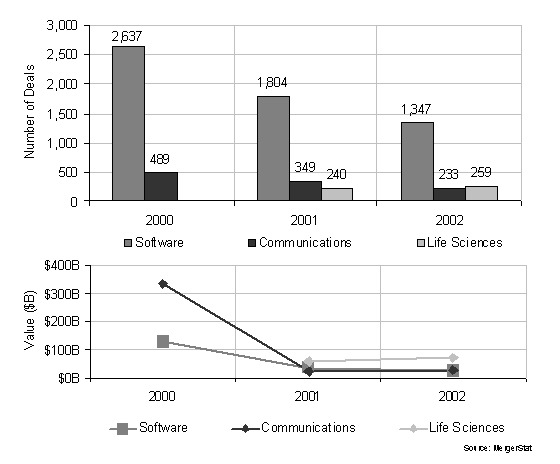
Software was the most active M&A category in 2002 with 1,347 deals, or 18% of the total (see Figure 6). In dollar volume, life sciences was the dominant sector at $72B, which was comprised primarily of Pfizer’s $60B stock purchase of Pharmacia. The aggregate transaction value within the software sector was $29B, which equates to an average purchase price of $21.5M. Venture Reporter indicates that 22% of all software M&A transactions were in the range of $10M to $24M, with 26% below this range. “Mega-deals” were limited, with only 18% over $100M.
Figure 6: U.S. Sector Specific M&A Activity

Software company M&A valuations, as a multiple of revenue, remained fairly constant throughout 2002. We analyzed three-hundred-sixty-two acquisitions and determined revenue multiples for more than one hundred. For the group, the median purchase price was 2.0 times the sellers’ trailing twelve-month revenue. On a quarterly basis, revenue multiples ranged from a low of 1.9x during the first quarter to a high of 2.2x during the second. The median multiple was 2.0x for the third and fourth quarters. Private sellers received a median revenue multiple of 2.2x, while their public counterparts came in at 2.0x. Though this may seem counterintuitive, as private companies typically sell for a discount due to their lack of liquidity, it reflects the large number of struggling public companies which sold at “fire sale” prices in 2002. Multiples are based on the equity purchase price and therefore do not factor in the buyers’ assumption of the acquired companies’ cash or interest bearing liabilities. Median revenue multiples by software industry sector for M&A transactions were as follows (see Figure 7):
Accounting/finance, 2.7x
Customer relationship management, 1.4x
Data/information management, 2.6x
Developer tools, 3.4x
Education/training, 2.2x
Enterprise systems management, 3.4x
Enterprise resource planning, 1.4x
Security, 4.5x
Storage management, 3.3x
Supply chain management, 0.8x
Figure 7: Software Industry Median M&A Multiples*

|
|


|

