|
|
| Home - Industry Article - May 08 Issue |
Top1Q08 Software Industry Mergers and Acquisitions |
By Ken Bender, Managing Director, and Kris Beible, Analyst, Software Equity Group, LLC
A complementary copy of Software Equity Group’s full 1Q08 Software Industry
Equity Report, which analyzes software industry public company stock market
performance, initial public offerings, mergers and acquisitions, and venture
capital and private equity financings, can be downloaded by visiting
www.softwareequity.com
 Figure 19: U.S. Merger and Acquisition Activity
Mergers and Acquisitions: The Numbers
Total M&A Spending and Deal Volume
Domestic M&A deal volume and aggregate M&A spending both declined sharply in
1Q08, compared to the same period a year ago. The first quarter tally of 2,084
deals, aggregating $182.9 billion (Figure 19), represented a 29% decline in
completed transactions and whopping 59% drop in aggregate purchase price on a
year-over-year basis. Internationally, global M&A deal volume fell 19%, and M&A
spending fell 22% year-over-year to $861 billion, according to Dealogic. The
global decline was largely attributable to economic uncertainty and a 65% YoY
decline in leveraged buyouts, that aggregated approximately $63.7 billion in
1Q08.
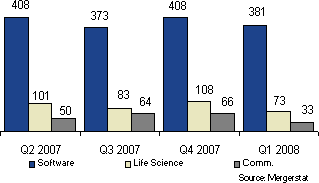
Figure 20: U.S. Software Sector M&A Activity
Software M&A Deal Volume and Spending
Software and IT services transactions accounted for 18% of total U.S. deal
volume in 1Q08, compared to 15% of all M&A transactions in 2007. Despite
accounting for a larger percentage of a substantially fewer number of deals,
domestic software/IT services activity in the first quarter consisted of 381
transactions (Figure 20), a 10% YoY decline, and a 7% decline from 4Q07.
Notwithstanding the decline in year-over-year deal volume, aggregate M&A
spending for the quarter soared to $70.1 billion, the highest single quarter
total to date, but not because most buyers dug deeper in their wallets. Eight
mega-deals, transactions with enterprise values equal to or greater than $500
million, accounted for 85% of total software dollars spent. The largest
mega-deal, of course, was Microsoft’s $42 billion (6.0x TTM revenue) proposed
acquisition of Yahoo, rejected and delayed, though in the view of many, all but
inevitable.
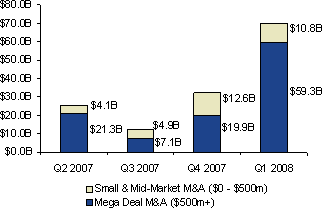
Figure 21: U.S. Software M&A by Dollar Volume
Several other noteworthy mega-deals(Appendix D), also helped to push up the
aggregate price tag, including Oracle’s acquisition of BEA Systems ($7.1
billion, 4.8x TTM revenue); Microsoft’s purchase of Fast Search & Transfer ($1.1
billion, 6.3x TTM revenue) and BMC’s acquisition of BladeLogic ($810.6 million,
11.7x TTM revenue).
Small and mid-market software M&A activity (transactions with enterprise values
less than $500 million) continued to comprise the bulk of transactions in Q1,
with buyers laser focused on highly strategic tuck-ins and bolt-ons. Of the
quarter’s 381 software mergers and acquisitions, 373 (98%) were small and
mid-market transactions that aggregated $10.8 billion (Figure 21). By
comparison, there were 405 small and mid-cap transactions worth $12.6 billion in
4Q07, and 412 transactions totaling $7.1 billion in 1Q07. The average small and
mid-cap transaction size was approximately $28.8 million in Q1, down slightly
from $31.1 million in 4Q07, but well above 1Q07’s $17.2 million average. The
takeaway: Public software companies remained acquisitive in Q1, but were more
circumspect as important purchase prices did not erode. For the moment, software
M&A seems resistant to the economic tide.
Figure 21: U.S. Software M&A by Dollar Volume
Editors Note: In January 2008 we enhanced our deal capture process to include a
significantly greater number of small cap/private transactions in our software
M&A database. We opted not only to be more comprehensive, but more accurate.
Beginning with this issue of our Quarterly Reports, our analysis of M&A
valuations is based upon enterprise value, rather than equity value, enabling
our readers to better understand the ‘true’ purchase price as a multiple of TTM
revenue and EBITDA (Enterprise value is defined as company's market
capitalization cash and cash equivalents + preferred stock + debt). To ensure
meaningful comparisons with prior quarters, we have recast our 2007 software M&A
valuation multiples in Figure 25 to also reflect enterprise value.
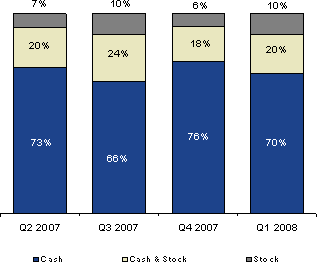
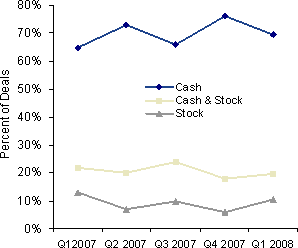
Deal Currency
As in past years, ‘cash only’ deals predominated in 1Q08, comprising 70% of
software M&A transactions, up slightly from 1Q07 (Figure 22). While the
percentage of all-cash deals has fluctuated quarter-to-quarter (mostly inversely
with the public markets), cash-only deals have grown in the past twelve months,
while cash and stock, and all-stock deals have declined. Contributing factors
are record amounts of cash-on buyer balance sheets, seller stock market
pessimism, and buyer reluctance to use devalued stock as deal currency (Figure
23).
Figure 23: Software M&A – Historical Form of Payment
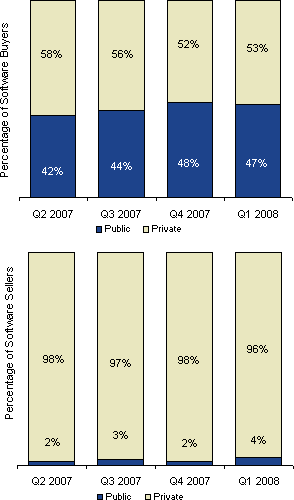
Figure 24: Public vs. Private Software M&A Buyers and Sellers
Private vs. Public Buyers
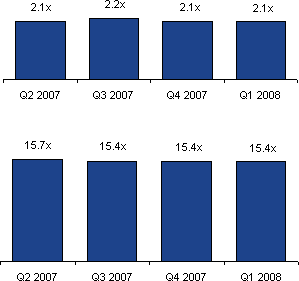
Figure 25: Software M&A Valuation as a Multiple of Revenue & EBITDA
In our 2006 and 2007 Quarterly Reports, private buyers comprised approximately
35% of all software M&A acquirers, over the past eight quarters. The expansion
of our database to capture a significantly greater number of smaller software
M&A transactions resulted in a materially higher percentage (53%) of private
buyers in 1Q08, since most of these hard-to-find smaller deals are by private
software companies merging with equals or acquiring even smaller counterparts.
We then restated each of the prior three quarters by making corresponding
changes, to enable valid quarter-over-quarter comparisons (Figure 24). The
outcome of this expanded analysis was eye opening. During each of the past four
quarters, private buyers have accounted for the majority of all software M&A
transactions. Likely explanations for the decline in private buyers, from 58% in
2Q07 to 53% in 1Q08, include fewer tuck-ins by private-equity backed platform
companies, and fewer small deals due to the lack of third-party debt financing.
M&A Valuations
SSoftware M&A valuations held steady in the first quarter, despite macroeconomic
turmoil. On a multiple of revenue basis, the median purchase price in Q1 was
2.1x TTM revenue, on par with 4Q07, and slightly higher than the 1Q07’s 2.0x TTM
valuation. On a multiple of EBITDA basis, the Q1 median was 15.4x TTM EBITDA,
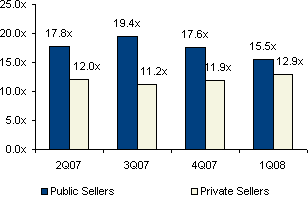
precisely the same as in the prior two quarters (Figure 25). Noteworthy is the
disparity in EBITDA exit multiples payable to public and private software
company sellers, which narrowed in 1Q08. In 4Q07 public sellers fetched a TTM
EBITDA multiple of 17.6x, while private sellers received an 11.9x multiple. In
1Q08 the TTM EBITDA multiple disparities shrunk to 15.5x for public companies
vs. 12.9x for private (Figure 26). The Q1 private company EBITDA multiple is, in
our view, an aberration that reflects the sale of a disproportionate number of
fast-growing, less profitable, VC-backed sellers that extracted top dollar when
measured on a multiple of EBITDA basis. In our experience, buyers typically
value non-VC backed, modest growth private sellers in the range of 5x – 10x TTM
EBITDA. As for public software company sellers, the steady decline of TTM EV/EBITDA
exit multiples, from 19.4x (3Q07) to 17.6x (4Q07) to 15.5x (1Q08), reflects a
concomitant decline in the EV/EBITDA market valuation of public software
companies over the same period. Once again, we caution our readers about using
median TTM revenue and EBITDA deal multiples to assess the fair market or
prospective exit valuation of a particular software company. The valuation range
is wide and valuation drivers are many and varied.
Figure 26: Public vs. Private Software M&A Valuation as a Multiple of EBITDA
As in past quarters, we analyzed all M&A transactions in 1Q08 with ascertainable
revenue multiples to determine the individual impact on valuation of equity
structure (private vs. public company), size (revenue) of buyer and seller, and
the seller’s software product category (Figure 27).
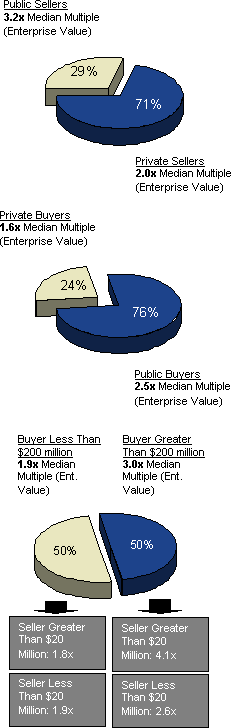
Figure 27: YTD Median Valuations – Segmentation
As a first step, we sorted Q1’s transactions by separating public from private
software company sellers to ascertain any difference in their median exit
valuation. The disparity was striking. Public company sellers commanded a
year-to-date median exit value of 3.2x TTM revenue, while private sellers posted
a substantially lower median valuation, 2.0x TTM revenue. This continues a trend
we noted in our 2007 Annual Report – undervalued public sellers have been picked
clean by strategic and financial acquirers, forcing acquirers to pony up
substantially greater sums of cash for financially healthier targets.
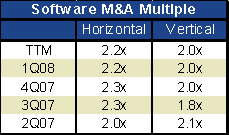
xFigure 28: Horizontal vs. Vertical Software M&A Multiples
As a next step in our analysis, we separated public and private software company
buyers to ascertain any difference in median purchase price paid. In
transactions where an exit valuation multiple was ascertainable, private buyers
(both strategic and private equity), comprised 24% of all software company
acquirers year-to-date and paid a median M&A price of 1.6x TTM. By contrast,
public software company buyers comprised 76% of such transactions and paid a
median purchase price of 2.5x TTM.
Figure 29: 1Q08 Horizontal vs. Vertical Sellers
Additionally, we analyzed Q1’s exit valuations by segregating vertical market
software transactions (e.g. retail, financial services, telecom, manufacturing,
etc.) from horizontal software transactions (infrastructure, enterprise
applications, etc.). In the first quarter, vertical market solution providers
accounted for 38% of all software M&A transactions and received a median 2.0x
TTM revenue exit valuation (up slightly from 1.9x in 2007), while horizontal
solution providers comprised 62% (Figures 28 & 29) of sellers, and commanded a
median 2.2x TTM revenue valuation (vs. 2.3x in all 2007). Healthcare, financial
services and telecommunications were the most active software M&A verticals in
1Q08, accounting for 26%, 19%, and 8%, respectively, of all vertical
transactions (Figure 30).
Figure 30: 1Q08 Software M&A Deal Activity by Category
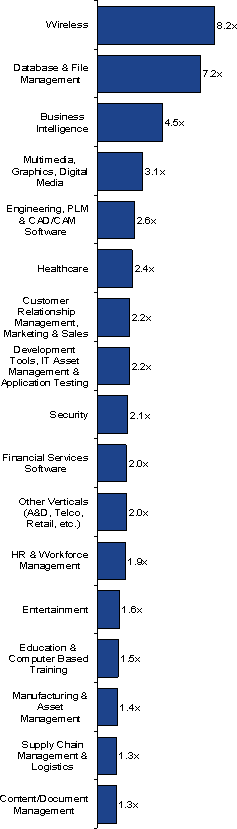
M&A Exit Valuations by Software Category
While size and software delivery model are key value drivers, software product
category continued to be the single most important M&A valuation driver. Among
the 17 product categories we ascribed median exit multiples to (Figure 31),
wireless software transactions led the pack, garnering a median 8.2x TTM revenue
exit value – buoyed by Nokia’s acquisition of mapping content provider NAVTEQ
($7.6 billion, 10.1x TTM revenue) and Wolfson Microelectronics’ purchase of
venture-backed microsound technology developer Sonaptic.
Database and File Management placed second, fetching a median 7.2x TTM revenue
valuation, driven by steep investment in database and data center automation
technologies by the likes of IBM, Hewlett-Packard, Sun Microsystems and others
in an effort further leverage their business intelligence software investments.
Exit multiples for remaining product categories ranged from a healthy 4.5x TTM
revenue for business intelligence providers, led by Microsoft’s purchase of
enterprise search provider Fast Search and Transfer for $1.1 billion or 6.3x TTM
revenue, to an anemic 1.3x for Supply Chain Management and Content/Document
Management providers.
Figure 31: Software M&A by Product Category
SaaS
SaaS providers continued to be highly attractive acquisition candidates in the
first quarter, and continued to extract a significant exit premium over their
perpetual license counterparts. SaaS transactions in Q1 extended well beyond CRM
and workforce management to business intelligence, content management, supply
chain management, security, mobile computing and internet infrastructure.
Vertical SaaS providers were especially popular, particularly those serving the
financial services and healthcare sectors. Representative transactions included
Citigroup’s acquisition of PayQuik and Metavante’s acquisition of BenSoft. GSI
Commerce’s acquisition of SaaS e-mail marketing automation provider e-Dialogue
for $167 million (4.9x TTM revenue) helped perpetuate the premiums being paid to
successful SaaS providers in the CRM and marketing management software
categories. Descartes Systems, a publicly traded Canadian provider of SaaS
logistics management solutions, acquiring SaaS routing and scheduling software
assets from privately-held Fluensee. Appendix E lists other notable Q1 SaaS
transactions.
Please visit www.softwareequity.com to download a complimentary
copy of the full Software Industry Equity Report, which analyzes software
industry public company stock market performance, initial public offerings,
mergers and acquisitions, and venture capital and private equity placements.
Software Equity Group is an investment bank and M&A advisory serving the
software and technology sectors. Founded in 1992, Software Equity Group has
represented and guided private companies throughout the United States and
Canada, as well as Europe, Asia Pacific, Africa and Israel, and has advised
public companies listed on the NASDAQ, NYSE, American, Toronto, London and
Euronext exchanges. Software Equity Group also represents several of the world's
leading private equity firms and was recently ranked among the top ten
investment banks worldwide for application software mergers and acquisitions.
 

|
|


|