By Gary Cokins, Global Product Marketing Manager, SAS Institute Inc.
Organizations increasingly want to better understand their revenues and
costs and, in particular, the behavior of factors that drive these top and
middle lines of the bottom-line profit equation. The reason for increased
interest in more detail is obvious: The margin for decision error is getting
slimmer. Mistakes in poor product selection, wrong channel options, or improper
customer targeting can no longer be offset by good choices made elsewhere in a
business.
What questions might managers and employee teams ask about their customers that
can be answered with detailed profitability reporting? Here are some examples:
- Do we push for volume or for margin with a specific customer?
- Are there ways to improve profitability by altering the way we package,
sell, deliver or generally serve different types of customers?
- Does the customer’s sales volume justify the discounts, rebates or
promotion structure we provide to that customer?
- Which products are relatively more profitable to cross-sell or up-sell?
- Can we realize the benefits from our changing strategies by influencing
our customers to alter their behavior to buy differently (and more
profitably) from us?
- Can we shift work to or from some of our suppliers based on who is more
capable or already has a superior cost structure compared with ours?
Risks from Inaccurate Cost Calculations
Companies plan and control their operations using accounting information that is
assumed to accurately reflect the costs of their products and standard service
lines. In fact, this is often not the case. The recorded expenses, such as
salaries and supplies, may be exact in their amounts because they are externally
audited and automated accounting systems capture them – but the problem is then
transforming those expenses into their calculated costs of the business
processes and the products that in turn consume those process costs.
The costing systems of many companies, with their aggregated summaries and their
broad averaging allocation of indirect costs, mask reality with an illusion of
precision. In fact, traditional cost systems typically provide misleading
information to decision makers with minimal transparency to understand what
constitutes a product’s cost. Companies that apply activity-based costing (ABC)
principles and their supporting software systems resolve the cost distorting
error of allocating expenses using broad averages (e.g., number of units
produced, sales amount, or labor input time). These cost allocations violate the
accounting principle of a cause-and-effect relation to transform consumed
expenses into calculated costs. ABC replaces broad averages with quantified
activity cost drivers that trace each work activity (at a reasonable level of
disaggregation) to the type of output, product or standard service-line that
causes and consumes the work activity.
To further complicate matters, with the shift in attention from products to
customer services, managers are also seeking granular ‘costs to serve’
customer-related information. These are not all the costs related to making a
product or delivering a standard service line (e.g., a bank checking account),
but rather they are the costs from interactions with customers, such as a help
desk call. The problem with accounting’s traditional gross profit margin
reporting (i.e., restricted to only product cost profit margins) is managers
cannot see the bottom half of the total picture – all the profit margin layers
eroded from distribution, selling, credit, payments, and marketing costs.
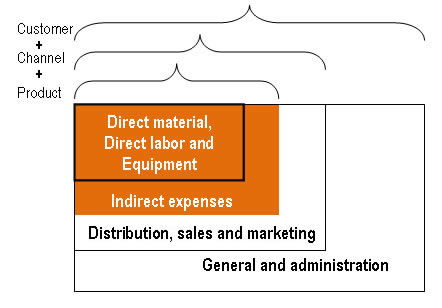
Exhibit 30.1 illustrates an organization’s entire expenses. The product and
standard service-line costs are in the shaded area. The concern here is tracing
the non-shaded area costs to types of channels and customers.
Exhibit 1. Costs from Sales and Marketing Are Not Product Costs
The unacceptable result of not converting these types of expenses into
customer-related costs is that executives, managers, and employee teams receive
incomplete profit reporting that is not segmented by customer; and the product
profitability data they do receive is flawed and misleading. They deserve fully
loaded cost and profit reporting that encompasses all the traceable expenses of
their end-to-end value stream costs–from supplier-related purchasing to customer
service. How can recent advances in managerial accounting methods and technology
deploy the vast potential that companies have from their business intelligence
systems?
Costs Need to be Causally Traced, Not Allocated on Broad Averages
Businesses with thousands of customers want to scale-up their cost and profit
reporting and visibility at the individual customer level, but their costing
systems cannot accomplish this. As a result, organizations lack the essential
information for making much better decisions about product mix, customer mix,
marketing, channel strategies and sales programs.
To better analyze revenue, cost and the resulting profit margin information,
businesses need to be able to define segmented reports on the fly. This includes
tracking profit for different time periods by individual customers, by
individual products and by specific sales channels, distribution channels,
branches, service centers, or sales outlets. To enhance the identification and
investigation of problems, organizations also need the flexibility of
at-a-glance and drill-down views to see costs and profits with fine granularity.
ABC systems are designed to produce profit and loss income statements for
customer segments and if needed for individual customers. With ABC product and
service-line related work activity costs are layered into each product and
service line. In addition cost-to-serve related work activity costs are
additionally layered into each channel and customer. The volume and mix of
products, service lines, and channel costs that each customer consumes is also
layered in.
Accountants rarely isolate and directly charge customer-related activity costs
to the specific customer segments causing these costs. As a result, in financial
accounting terms, the costs for selling, advertising, marketing, logistics,
warehousing and distribution are immediately charged to the time period in which
they occur. Accountants refer to these as period costs. But classifying expenses
that way is for external financial accounting for banks, investors, and
regulatory agencies. What we are discussing here is internal managerial
accounting to support the analysis and decision making of managers and employee
teams. The accountants must begin applying the same costing principles for
product costing, typically ABC principles, to types of channels and types of
customers so that there is visibility to all traceable and assignable costs.
Otherwise, you have no clue where you are making and losing money.
The problem is the accountants are not tasked to trace them to channels or
customer segments. But today’s selling, merchandising and distribution costs are
no longer trivial costs – they are sizable. There should be a focus on the
customer contribution margin devoid of simplistic and arbitrary cost
allocations. Companies with goals of sales growth at any cost need to temper
their plans with a goal of profitable sales growth.
In the end, services will be added to products, and unique services will be
tailored for individual customers. Activity-based costing data will be essential
to validate and prioritize the financial merits of which services to add and for
which customers.
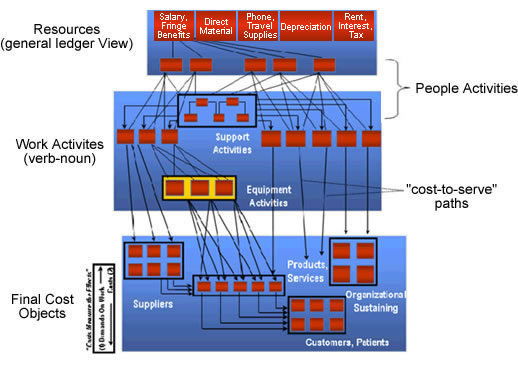
ABC resolves the costing accuracy problem with its rational cause-and-effect
cost tracing logic. It complies with accounting’s causality principle. ABC
transforms each department’s expenses as captured in the general ledger
accounting system into its calculated costs of work activities (that belong to
business processes) and ultimately into its products, service lines, channels
and customers.
Exhibit 2 illustrates an organization’s enterprise-wide expense structure
flowing into the ultimate final costs of its end-customers and its
organizational sustaining cost (i.e., those expenses transformed into work
activity costs that are not caused or traceable to products or customers).
Exhibit 2. Activity-Based Cost/Management Cost Assignment Network
Equipped with a costing methodology that correctly models the consumption of
resources base on accounting’s causality principle, one can rely on its
information to be valid for reliable analysis, control, planning and decision
support.
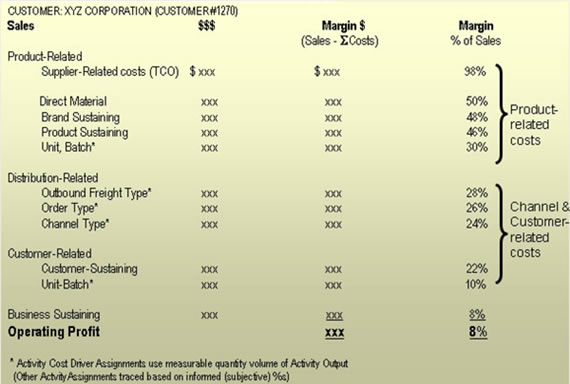
What Is Needed Is a Profit and Loss Statement for Each Customer
Exhibit 3 illustrates the individual customer profitability statement that is
the result of these cost layers. Using ABC, there can now be a valid profit and
loss (P&L) statement for each customer as well as logical segments or groupings
of customers. A tremendous amount of detail lies below and within each of these
reports. For example, the individual products and service lines purchased can be
examined in greater detail; they comprise a mix of high and low margins based on
their own unit costs and prices. In other words, in a customer-specific P&L
summary, the product or service line is reported as a composite average, but
details about the mix are viewable. In addition, within each product or service
line, the user can further drill down to examine the content and cost of the
work activities and materials for each product and standard service line.
Exhibit 3. Customer Profit and Loss Statement
ABC users refer to this data mining and navigating as ‘multidimensional
reporting;’ and they use the online analytical processing (OLAP) software tools
for viewing the output of the ABC calculation engine. This is powerful
information. The sum of all the customer P&L statements for this type of report
will be the entire business’s enterprise-wide profit (or loss). That is, it can
be reconciled with the company’s official books: Its total spending and the
resulting ‘bottom line.’
Performance management systems combine ABC information with planning and
performance measure and alignment tools; but what makes performance management
so appealing is that it is work-centric. The foundation for performance
management is built on what people and equipment do, how much they do it, and
why.
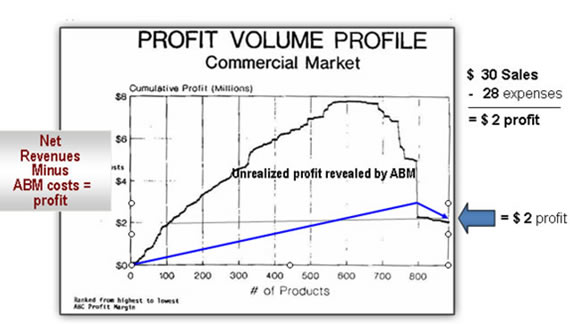
With valid cost modeling, Exhibit 4 displays a graph line at the top – referred
to as the ‘profit cliff’ of the true cumulative build up of each product’s
profit rank ordered from the most profitable to the least (often products at a
financial loss where their costs exceed their revenues). The graph illustrates
how unrealized profits can be hidden due to inadequate costing methods. The
accountants are not properly assigning the expenditures based on the causality
principle of accounting. The graph is of each product’s cost, net of sales, to
reveal each product’s and service line’s profit.
Exhibit 4. Cumulative Profit Distribution by Product
The products are rank-sorted left-to-right from the largest to the smallest
profit margin rate. The very last data point equals the firm’s total net profit,
as reported in its profit and loss (P&L) statement. For this organization, total
revenues were $20 million with total expenses of $18 million, to net a $2
million profit, but the graph reveals the distribution of the mix of that $2
million net profit. Although not empirically tested, experiences with these
measures show that the total amount of the profits, excluding any losses,
usually exceeds 200% of the resulting reported net profit; greater than 1000%
has even been measured.
ABC information is typically shocking to executives and managers since their
prior belief from their traditional broadly averaged costing method is the flat
graph line at the bottom with the small decline where each product’s cost was
distorted. This graph line has its accuracy removed by the broad-brush averaging
of traditional cost allocations rather than tracing and assigning each activity
cost using its proportionate activity cost driver.
Migrating Customers to Higher Profitability
What does all this information reveal? First, it quantifies what everyone may
already have suspected: All customers are not the same. Some customers may be
more or less profitable based strictly on how demanding their behavior is.
Although customer satisfaction is important, a longer-term goal is to increase
customer and corporate profitably. There must always be a balance between
managing the level of customer service to earn customer satisfaction and what
the impact from doing that will have on shareholder wealth. The best solution is
to increase customer satisfaction profitably. Because increasingly more
customers will expect and demand customization rather than standard products,
services, and orders, understanding this balance will be important.
ABC data facilitate discussions about arriving at that balance. Many managers
are unwilling to take any actions until presented with the facts.
In the company P&L in Exhibit 3, there are two major ‘layers’ of contribution
margin:
1. By mix of products and service lines purchased
2. By ‘costs-to-serve’ apart from the unique mix of products and service lines
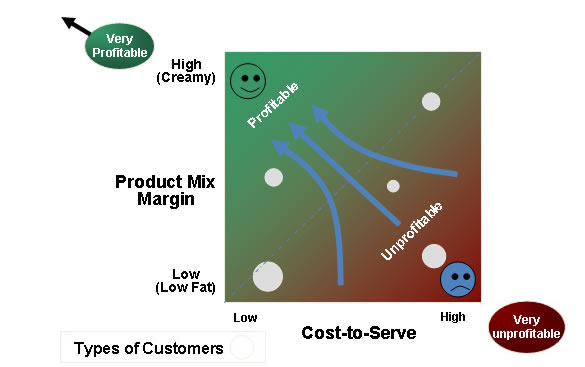
Figure 5 combines these two layers. Any single customer (or cluster) can be
located as an intersection. Figure 5 provides a two-axis view of customers with
regard to the two layers just described, the ‘composite margin’ of what each
purchases (reflecting net prices to the customer) and its ‘costs-to-serve.’ The
exhibit debunks the myth that companies with the highest sales must also
generate the highest profits.
Note that migrating customers to the upper-left corner is equivalent to moving
individual data points in the profit profile in Exhibit 30.3 from right to left
and bottom – to top. Knowing where customers are located on the matrix requires
ABC data.
Exhibit 5. Migrating Customers to Higher Profitability
Segmenting customers with ABC requires some different filters that we will
discuss next.
Options to Raise the Profit Cliff Curve
What does a commercial organization do with the customer profit information? In
other words, what actions can an organization take to increase its profits? This
is all about the ‘M’ in activity-based management (ABM), the managing of costs
and profits. Some customers may be located so deep in the lower-right corner of
the customer profitability matrix that the company will conclude that it is
impractical to achieve profitability with them and they should be terminated.
After all, the goal of a business is not to improve customer satisfaction at any
cost, but rather to attempt to manage customer relationships in order to improve
long-term corporate profitability.
The objective is to make all customers more profitable, represented by driving
them to the upper-left corner. Although this is a partial list, making customers
more profitable can be accomplished by:
- Manage each customer’s costs-to-serve to a lower level
- Establish a surcharge for or re-price expensive cost-to-serve activities
Reduce services
- Introduce new products and service lines
- Raise prices
- Abandon products, services, or customers
- Improve the process
- Offer the customer profit-positive service level options
- Increase costs on activities that a customer shows a preference for
- Shift the customer’s purchase mix toward richer, higher-margin products
and service lines
- Discount to gain more volume with low cost-to-serve customers
Before doing anything and acting hastily, it is important for anyone
interpreting the profit distribution diagram to understand the following key
issues about the diagram:
- This snapshot view of a time period’s cost does not reflect the life-cycle
costs of the products, service lines, or customers that have consumed the
resource and activity costs for that particular time span.
- The information represented in the graph should not be prematurely or
spontaneously acted on. Analysts must appreciate the large difference
between what information is and what making an actionable decision is. They
are not the same.
The important point is that ABC provides fact-based data from which
discovery and questions can be asked. Always remember this: In the absence
of facts, anyone’s opinion is a good one. And usually the biggest opinion
wins! This includes the opinion of your boss or of your boss’ boss. So, to
the degree senior managers are making decisions based on intuition, gut
feel, misleading information or politics, then your organization is exposed
to the risk of poor decisions.
Computer Technology Enables Customer Profitability Reporting
A revolution has occurred in computer technology that allows large-scale and
detailed profitability reporting. In the past, achieving ever-higher levels
of cost accuracy were simply not justified given the extra work involved.
But today, applying computer technology converts that administrative effort
to near zero (after the automated cost system is initially designed and
configured). Further, data storage capacity is now economical.
The attraction of effective costing system is that it can economically scale
to accommodate billions of transactions, access data from diverse multiple
source systems, and be deployed for remote Web-enabled analysis. It reports
validly calculated profits on a moment’s notice rather than two weeks after
a month has ended. As a bonus, with projected sales volume and mix, it
enables reliable what-if scenarios for test-and-learn as well as pro forma
profit-and-loss forecasts.
Profitability reporting at a detailed level gives a meaningful business
context to the realm of business intelligence (BI). In the end, managerial
accounting is just data. It is to be used as a means to an end – namely
decision making. The quality and accuracy of managerial accounting data is
therefore critical.
Because most businesses today have automated transaction and production
systems, the data that costing error is sensitive to is already accurately
captured. 1This means customer profitability information can be instantly
reported at any time on demand. This provides robust information for
customer profit analysis.
Future competitive differentiation will be based on the rate of speed at
which organizations learn, not just the amount they learn. Having all this
revenue, cost and profit margin data is only a beginning. People have to act
on and make decisions with the data.
Coming to Grips with Reality
The CFO can and should work more closely with the marketing and sales
functions to measure and report the nonfinancial balanced scorecard key
performance indicators (KPIs) that impact or reflect the customers’ total
experience and satisfaction. Progressive CFOs understand how customer
experience drivers achieve strategic objectives and indirectly influence
financial results.
Increasingly more organizations are coming to this realization of flawed or
dysfunctional cost reporting, however, they are intimidated by the perceived
tall heights that they would need to scale to return to the levels of cost
accuracy once enjoyed when output diversity was narrow and overhead expenses
were small. Inevitably they come to grip with their predicament. Should they
reform their managerial accounting method using ABC principles and lean
accounting techniques? Or should they take no action and remain with the
status quo hoping that the lack of transparency of indirect costs, their
drivers, and the degree of misleading information will not too adversely
result in bad decision making. In either case, they are both a choice the
accountants are making. That is, to change or not to change–both are
choices, where either option could be inappropriate.
1For advanced systems, there are extraction, transform, and load (ETL) tools
that are applied for input data cleansing to assure higher accuracy of the
calculated and reported information.
This article is an excerpt from Gary Cokins’ book: Performance Management:
Integrating Strategy Execution, Methodologies, Risk Management, and
Analytics; ISBN 978-0-470-44998-1; John Wiley and Sons (2009). Reprinted
with permission.
Gary Cokins, CPIM, is Global Product Marketing Manager of
Performance Management Solutions with SAS, a global leader in business analytics
and performance management software. He is an internationally recognized expert,
speaker and author in advanced cost management and performance improvement
systems. After earning an Industrial Engineering degree from Cornell University
in 1971 and an MBA from Northwestern University Kellogg Graduate School of
Management, Gary began his career as a Financial Controller and Operations
Manager with FMC Corp. He worked for15 years as a Consultant at Deloitte, KPMG
Peat Marwick and Electronic Data Systems (EDS), where he headed EDS’ Cost
Management Consulting Services. Gary was the lead author of the acclaimed “An
ABC Manager’s Primer” sponsored by the Institute of Management Accountants (IMA).
His “Activity-Based Cost Management: An Executive’s Guide” recently ranked as
the best-selling book of 151 titles on the topic. Gary’s other books include
“Activity-Based Cost Management: Making it Work,” “Activity-Based Cost
Management in Government”, and his latest work, “Performance Management:
Integrating Strategy Execution, Methodologies, Risk, and Analytics.” He has
served on committees of professional societies including CAM-I, AICPA, the
Supply Chain Council, the American Society for Quality (ASQ) and the Institute
of Management Accountants (IMA). Gary is a member of the editorial advisory
board of the Journal of Cost Management. For article feedback, contact Gary at
gary.cokins@sas.com
 

|