|
|
| Home - Software M&A Review - November 09
Issue |
Mergers and Acquisitions: The Q309 Numbers
|
By Software Equity Group, LLC
M&A Deal Volume and Spending: All Industry Sectors
Domestic M&A deal activity and spending both improved in the third quarter
(3Q09)
Figure 19: U.S. Merger & Acquisition
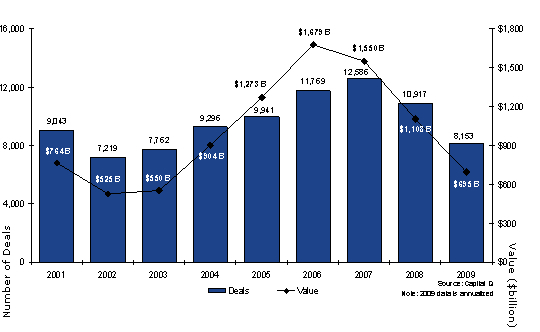
M&A transaction volume across all US industry sectors aggregated 2,141 deals, a
6% increase over 2Q09’s 2,012 transactions, but still 27% lower than the same
quarter last year. M&A spending in 3Q09 increased from the prior quarter, but
was down year-over-year. The total price tag of $144 billion in 3Q09 marks a 38%
increase from 2Q09’s $104 billion, and a 55% decline from 3Q08’s $317 billion
dollar M&A spend (Figure 19).
The increase in 3Q09’s M&A spending was largely attributable to a greater number
of mega-deals. There were 31 transactions with price tags greater than $1
billion, compared to only 21 such big deals in 2Q09. A year ago in 3Q08, total
domestic M&A spending was buoyed by 41 transactions greater than $1 billion.
We believe Q4 will show continued improvement in overall M&A deal volume and
spending. Many buyers will find mega-deals irresistible, given the compelling
combination of a recovering economy, healthy balance sheets and reasonable
target valuations.
There were a fewer number of US leveraged buy-outs and private equity backed
transactions in Q3, but total valuations increased and LBO spending across all
industry sectors improved. According to Capital IQ, there were 172 leveraged
buy-outs in 3Q09, down from 187 in 2Q09, and well below 3Q08’s 245 deals.
However, $3.6 billion was spent on LBOs in 3Q09, more than double 2Q09’s $1.7
billion, yet far less than the $5.1 billion spent in 3Q08.
Globally, it was very much the same. There were 482 LBOs and private equity
transactions worth $9.1 billion worldwide in 3Q09, compared to 544 deals worth
$8.4 billion in 2Q09 and 678 transactions aggregating $25.7 billion
year-over-year. In an effort to shore up confidence among their limited partners
whose appetites for risk have changed since the downturn, PE firms appear to be
taking pains to pursue opportunities that feature defensible valuations, minimal
risk and reasonable returns.
Software M&A Deal Volume and Spending
Figures 20 & 21: U.S. Software Sector M&A Activity and Dollars Spent
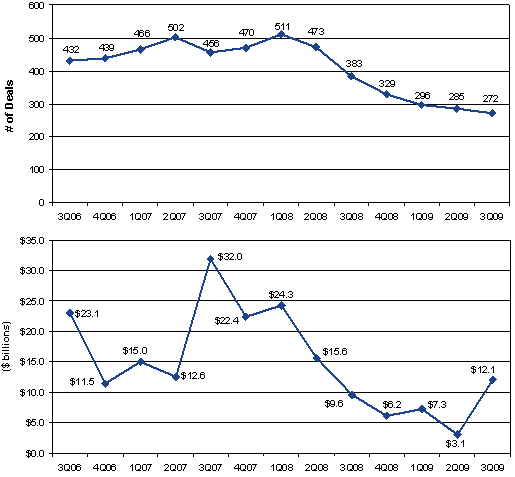
Software M&A transactions accounted for 12.7% of all U.S. M&A activity in 3Q09,
down slightly from 14.2% in 2Q09. The third quarter’s 272 software mergers and
acquisitions had an aggregate purchase price of $12.1 billion, compared to 285
transactions aggregating a paltry $3.1 billion in 2Q09 (Figures 20 and 21).
Unlike prior quarters, when a few mega-deals accounted for a disproportionate
share of M&A dollars spent, Q3 showed a marked increased in the exit valuations
of small and mid-cap software companies. The $9.7 billion spent on sub-$500
million software deals represented 80% of total software M&A spending in 3Q09,
compared to $2.3 billion spent on such smaller deals in 2Q09 comprising 74% of
total software M&A spending. Only two mega-deals were recorded in 3Q09: Adobe’s
acquisition of Omniture ($1.6 billion, 4.7x TTM revenue) and IBM’s acquisition
of SPSS ($784 million, 2.7x TTM revenue).
Deal Currency
Figure 22: Software M&A Form of Payment
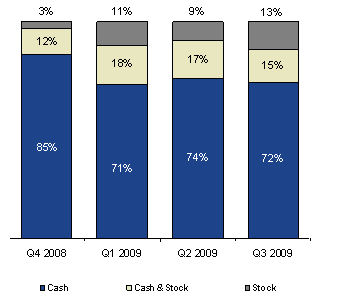
The percentage of all stock software M&A transactions declined steadily in 2H08
as the markets tanked, falling to 3% in 4Q08. As the markets began to recover in
2009, stock predictably became more palatable as partial deal currency. The
stock market’s continued recovery spurred a comeback in all stock deals in Q3,
accounting for 13% of transactions in 3Q09, compared to 9% of all deals in 2Q09
(Figure 22).
All cash deals, which have comprised a median 73% of all acquisitions since
1Q07, accounted for 72% of transactions in 3Q09, down slightly from 74% in 2Q09.
A year ago in 4Q08, when stock prices were in virtual free fall, exiting
founders and scared seller shareholders pushed the percentage of cash deals to
85% of all software M&A transactions.
Transactions featuring a combination of cash and stock decreased slightly to 15%
of Q3’s software M&A total, compared to 17% in 2Q09 (Figure 22).
As M&A deal activity ramps and buyers venture further afield when making
strategic acquisitions, look for the percentage of deals with stock as currency
to grow, particularly when the acquirer considers the continued interest of a
visionary founder/principal to enhance the prospects of a successful outcome.
Private vs. Public Buyers
Figure 23: Public vs. Private Software M&A Buyers and Sellers
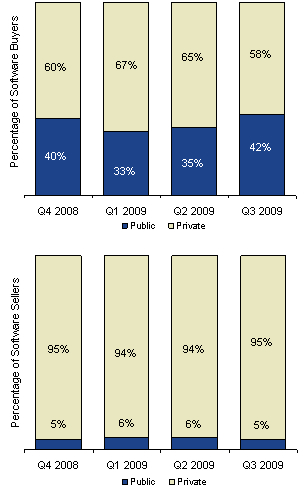
Public buyers stepped up their acquisition activity in Q3, encouraged by
forecasts of increased enterprise IT spending and by target valuations they
perceived as still reasonable. Public companies accounted for approximately 42%
of all software M&A buyers in 3Q09, up from 33% in 1Q09 and 35% in the second
quarter (Figure 23).
As the economy continues its recovery and IT spending improves, look for public
companies to drive 45% or more of software M&A, at least until target prices
inflate and private equity acquirers reengage.
M&A Valuations
Figure 24: Software M&A Valuation as a multiple of revenue
(Quarterly)
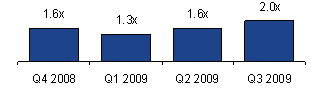
Figure 25: Public Software Company Seller Valuation as a Multiple of EBITDA
The software industry’s benchmark exit metric rose sharply in 3Q09 to a median
2.0x TTM revenue, a noteworthy improvement over Q2’s median 1.6x TTM revenue
multiple (Figure 24). This rising trend in median valuation indicates
bargain-hunting is waning, buyers are placing more strategic bets, and sellers
are asking – and getting – more. Q3 marks the second consecutive
quarter-over-quarter increase in median exit valuation, which is something we
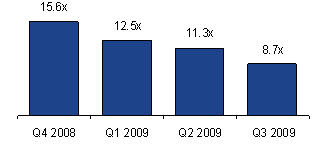
haven’t seen since Q2 – Q4 of 2005. On a multiple of EBITDA basis, there was
insufficient data from private seller software M&A transactions to ascertain the
median EBITDA exit multiple in 3Q09. Instead, we analyzed the EBITDA exit
multiples only for those transactions featuring public sellers. Public software
company sellers commanded a modest 8.7x TTM EBITDA exit multiple in 3Q09, down
from 2Q09’s 11.3x (Figure 25).
The decline in median TTM EBITDA exit multiple from 2Q09 is primarily
attributable to several 3Q08 transactions with highly inflated EBITDA multiples
dropping out of the 3Q09 calculation. In most cases, the sellers were top line,
rather than bottom line, focused and either breakeven or marginally profitable.
Examples of such 3Q08 transactions with highly inflated EBITDA multiples
include: McAfee’s acquisition of Secure Computing (1.9x TTM revenue, 137.9x TTM
EBITDA), IBM’s acquisition of ILOG SA (1.1x TTM revenue, 40.2x TTM EBITDA), and
Tripos’ acquisition of Pharsight (1.4x TTM revenue, 17.8x TTM EBITDA). As these
earlier high multiple of EBITDA deals fell out of Q3’s TTM calculation, the 3Q09
EBITDA multiple consequently declined.
Figure 26: 2009 YTD Median Multiples – Segmentation (Enterprise
Value/Revenue)
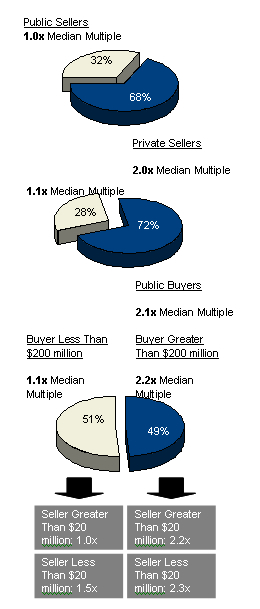
We’ve repeatedly demonstrated in prior SEG Quarterly Reports that three of the
most important determinants of exit valuation are the seller’s equity structure,
financial performance and product category (Figure 26). To determine if the same
held true, once again, in 3Q09, we analyzed all 2009 YTD M&A transactions with
ascertainable revenue multiples to determine how exit valuation was affected by
ownership status (private vs. public company), size (revenue) of buyer and
seller, and the seller’s software product category.
As a first step, we sorted 2009’s YTD transactions by ownership type, separating
public from private software company sellers to ascertain any difference in
median TTM exit multiple. Public company sellers received a median 1.0x TTM
revenue exit valuation, while privately held software companies commanded a
median 2.0x TTM revenue multiple.
The wide variance between public and private seller exit multiples in 2009
reverses a well-established trend. Over the past few years, we’ve noted a
shrinking variance between public and private seller exit valuations, with
traditionally higher public company exit premiums declining over time as public
stock market valuations dropped and many of the best performing and most
valuable public companies were acquired.
In 2009 YTD, the public software company exit premium was driven down further,
as several struggling public software companies were essentially forced to sell
at distressed valuations: Micro Focus acquired Borland Software ($78 million,
0.5x TTM revenue); Unify acquired AXS-One ($9 million, 0.7x TTM revenue); Infor
acquired SoftBrands ($81 million, 0.8x TTM revenue); and Vista Equity Partners
acquired SumTotal Systems ($107 million, 0.9x TTM revenue). Please see Appendix
B (page 22) for additional public seller exit valuations in 3Q09.
Conversely, many of the highest multiple transactions were private software
companies deemed by their large public suitors to be highly strategic and worthy
of an acquisition premium. Many of these private targets were venture-backed
entities that were well-funded, growing and, consequently, expensive. Noteworthy
examples include VMWare’s acquisition of SpringSource ($446 million, 14.8x TTM
revenue estimate); BlackBoard’s acquisition of Angel Learning ($100 million,
4.0x TTM revenue estimate); Cisco’s acquisition of Tidal Software ($105 million,
4.0x TTM revenue estimate); and Phase Forward’s acquisition of Waban Software
($14 million, 3.5x TTM revenue).
As a next step, we separated public and private software company buyers to
ascertain any difference in median purchase price paid in 2009. For historical
context, in 2006 and 2007 public buyers shelled out a median of 2.7x and 2.5x
TTM revenue, respectively, while private buyers paid 1.9x and 2.0x TTM revenue,
respectively. In 2008, we saw the historical variance narrow to a near all time
low, with private buyers (both strategic and private equity) paying a median M&A
purchase price of 1.7x TTM revenue, compared to public software companies paying
a median purchase price of 2.0x TTM revenue.
During the first three quarters of 2009, the public-private buyer differential
increased drastically. Public buyers paid a median 2.1x TTM revenue, well within
historic norms. Private buyers, however, paid a miserly 1.1x TTM revenue exit
multiple, in many cases acquiring competitors that were struggling to survive
the downturn.
We slice and dice software M&A transactions this way in part to remind our
readers that the median software industry TTM revenue and EBITDA exit multiples
we report each quarter have little bearing on the prospective exit valuation of
a particular software company. Examples abound of companies selling for modest
multiples in strong economies and eyebrow-raising multiples in tough economic
times. In every economy, the software company valuation range is wide and the
valuation drivers are many and varied. Wonder what your $10M+ revenue software
company is likely worth in the current market?
Figure 27: 2Q09 Horizontal vs. Vertical Sellers
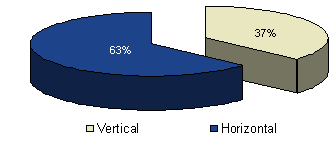
We also analyzed 3Q09’s median software M&A multiple horizontally and
vertically, segregating vertical market software company sellers (e.g. retail,
financial services, telecom, manufacturing, etc.) from sellers with horizontal
software solutions (infrastructure, enterprise applications, etc.). In 3Q09,
providers of vertical software accounted for 37% of all software M&A, confirming
vertical providers remain, for the time being, attractive acquisition targets,
primarily because of their predictable and substantial recurring revenue, domain
expertise and highly defensible market positions (Figure 27). Horizontal
solution providers comprised 63% of sellers.
While vertical market software providers are still in demand, they’re not
fetching the same premiums of a year ago. Through the first three quarters of
2009, the median revenue multiple for horizontal companies has outpaced that of
verticals, which is entirely consistent with the valuation differential that
prevailed for ten years – until the last three quarters of 2008. In Q2 - Q4 of
2008, vertical M&A multiples, buoyed by a record number of VC backed private
company exits and private equity buy-outs, equaled and at times doubled the
median horizontal M&A exit valuation, topping out at 2.7x TTM revenue in 3Q08
compared with 1.3x TTM revenue for horizontal providers the same quarter.
Figure 28: Horizontal vs. Vertical Software M&A Multiples
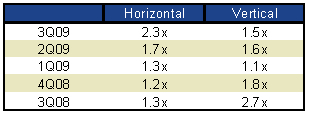
That’s not been the case in 2009. Vertical M&A transactions in Q3 had a median
multiple of 1.5x TTM revenue, down slightly from 1.6x in 2Q09. Horizontal M&A
transactions, however, garnered an impressive median 2.3x TTM revenue multiple
in the third quarter, up from the prior quarter’s 1.7x TTM revenue exit multiple
(Figure 28).
It’s clear that, overall, software M&A valuations are rebounding. The low M&A
volumes and higher exit valuations, however, make clear the current market
remains highly selective and favors the hail and hearty – software companies
offering best-of-breed solutions in hot product categories that are growing
faster than the market norm. But what about the others? What are the exit
prospects of the vast majority of public and private software companies?
For many of these more typical software providers, exit valuations have
improved, albeit modestly. Will the trend continue? If you’re looking for signs
of software M&A springtime, look for increased deal volume (>300 North American
software transactions per quarter) while maintaining a ~2.0x TTM revenue median
exit valuation. That’s likely to happen when GDP improves and buyer optimism is
restored. Look for sustained increases in IT spending, particularly in
discretionary IT spending for non-essential or non-cost justifiable items. Look
for an increase in public software company new license revenue growth. Look for
heated up competition among the biggest rivals as they foray into each others’
strongholds (Google’s OS plans, Oracle’s Sun acquisition, and Microsoft’s search
engine deal with Yahoo!). Look for increased activity (actual, rather than
espoused) of mid-cap software companies in pursuing strategic acquisitions. And
finally, look for private equity investors to adjust their investment criteria
to reflect a bit less financial security and a bit more risk.
M&A Exit Valuations by Software Category
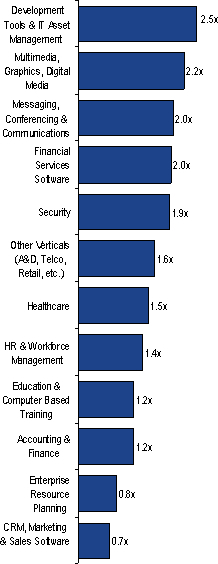
Figure 29: Software M&A by Product Category
While company size and software delivery model demonstrably impact valuation,
software product category continued to be the single most important M&A
valuation driver in 3Q09. For most software product categories, there is often
an insufficient number of transactions that publicly report both seller TTM
revenue and buyer purchase price, essential data in ascertaining the applicable
median exit value for the product category. Consequently, we aggregate the data
each quarter on a TTM basis. As a result, it may take several quarters to detect
changing product category valuation trends, and certain outlier transactions
consummated nine or twelve months ago may have a residual impact on their
product category multiples.
Among the 12 product categories we tracked in 3Q09 (Figure 29), Development
Tools/IT Asset Management software providers led the pack.
Transactions in this category, which garnered a 2.5x TTM revenue median exit
valuation, included Telephonetics’ acquisition of Eden Origin ($5.6 million,
7.2x TTM revenue) in 1Q09; Cisco’s acquisition of Tidal Software ($105 million,
4.0x TTM revenue estimate) in 2Q09; EMC’s acquisition of Configuresoft ($87
million, 3.0x TTM revenue estimate) in 2Q09; and VMWare’s acquisition of
SpringSource ($446 million, 14.8x TTM revenue estimate) in 3Q09.
Exit valuations for other software product categories ranged from 2.2x TTM
revenue for providers of Multimedia, Graphics, and Digital Media software, to
0.7x TTM revenue for traditional (on-premise) Customer Relationship Management
software. Exit valuations in the Multimedia, Graphics and Digital Media category
fluctuated most widely over the past two quarters, increasing from 1.1x TTM
revenue in 2Q09 to 2.2x in 3Q09.
Figure 30: Software M&A by Product Category
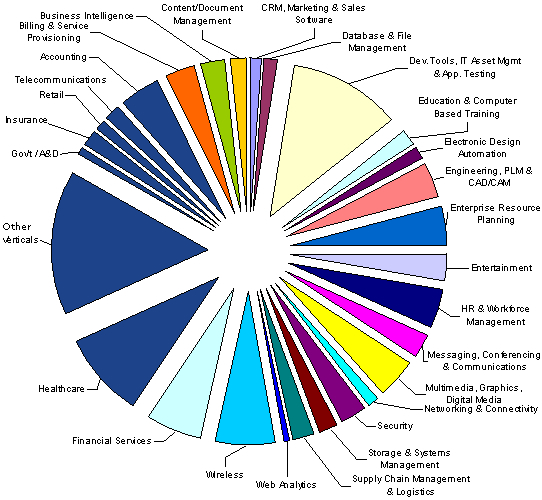
From a deal activity standpoint, Development Tools/IT Asset Management and
Healthcare led all other product categories in 2Q09 (Figure 30).
M&A Exit Valuations for SaaS Companies
Figure 31: Historical Public SaaS Company Financial Performance vs.
Median SaaS Exit Multiples (EV/TTM Revenue)
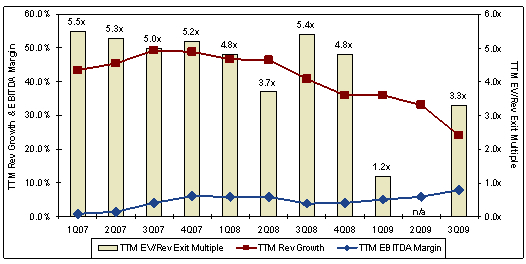
There’s nothing like a major recession to take the wind out of the sails of a
high-flying technology trend. Until 3Q08, the stellar revenue growth of SaaS
providers, their promise of a more predictable and profitable revenue model, and
unprecedented hype by many industry pundits who regarded SaaS as the second
coming, helped drive SaaS exit multiples through the roof (e.g., median 5.5x TTM
revenue in 1Q07; 4.8x in 1Q08).
Then came Lehman Brothers, sub-prime mortgage defaults, AIG, etc. The recession
took its toll on both enterprises and small/medium businesses (SMBs) alike, IT
spending plummeted, and the median TTM revenue growth rate of the public
companies comprising our SEG SaaS dropped steadily, from 46.5% in 2Q08 to 40.9%
in 3Q08 to 35.9% in the final quarter (Figure 31).
It took some time for the rapidly declining SaaS growth rates to sink in. SaaS
exit valuations remained high in 3Q08 (5.4x TTM revenue) and 4Q08 (4.8x TTM
revenue). However, far fewer buyers showed an appetite for such lofty multiples.
The number of SaaS M&A transactions declined quickly and sharply – from 36 deals
in 1H08 to 25 SaaS exits in 2H08, a 31% drop.
In 1H09, as the median TTM growth rate of public SaaS companies continued to
fall, M&A activity and exit valuations slipped further, as well. There were only
nine SaaS deals reported in 1Q09 with a median exit valuation of 1.2x TTM
revenue, and eight SaaS transactions in 2Q09 (insufficient data to calculate a
reliable median exit multiple).
In 3Q09, however, after four consecutive quarters of decline, SaaS M&A activity
and exit valuations both improved. Q3 saw thirteen SaaS companies exit for a
median valuation of 3.3x TTM revenue. Notable SaaS deals in 3Q09 include
Omniture’s announced sale to Adobe ($1.6 billion, 4.7x TTM revenue), Etap-On-Line’s
acquisition by Concur ($40 million, 3.3x TTM revenue), and The Fuel Team’s sale
to United Business Media ($7 million, 2.0x TTM revenue).
Perhaps even better times lie just ahead. As we went to press, Compuware
snatched SaaS provider Gomez from the IPO pipeline by agreeing to pay $319
million (6.1x TTM revenue). Considering Gomez’ TTM revenue growth rate of 35.8%
and 11% EBITDA margin, it remains to be seen whether the exit valuation is an
anecdote or a trend.
Please visit
www.softwareequity.com
to download a complimentary copy of the full 3Q09 Software Industry Equity
Report, which analyzes software industry public company stock market
performance, initial public offerings, mergers and acquisitions, and venture
capital and private equity placements. Software Equity Group is an investment
bank and M&A advisory serving the software and technology sectors. Founded in
1992, Software Equity
Group has represented and guided private companies throughout the United
States and Canada, as well as Europe, Asia Pacific, Africa and Israel, and has
advised public companies listed on the NASDAQ, NYSE, American, Toronto, London
and Euronext exchanges. Software Equity Group also represents several of the
world's leading private equity firms and was recently ranked among the top ten
investment banks worldwide for application software mergers and acquisitions.
 

|
|


|


