|
|
| Home - Software M&A Review - Jul 03 Issue |
Software M&A - Q2 in Review |
By Ken Bender, Managing Director, and Allen Cinzori, Associate - Software Equity Group, LLC
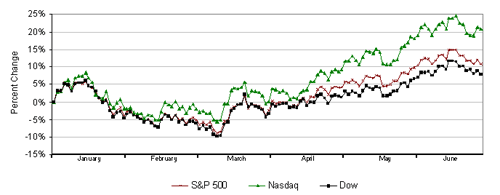
The second quarter provided reason for guarded optimism about the nation’s economic outlook. The technology sector led a sustained and impressive stock market rally. For the quarter, the S&P 500, NASDAQ and Dow were up 15%, 20% and 12%, respectively. Improved earnings reports, smaller inventory reserves, continued Fed rate cuts and an aggressive fiscal policy were the catalysts many investors needed. Investors also seemed comforted by a more stable geopolitical picture.
Relative to the first quarter, total U.S. M&A activity increased 31% and dollar value was up 38%. M&A activity in the software industry continues to lead all other sectors. According to MergerStat, software accounted for 300 deals in Q2, approximately 15% of all U.S. M&A activity for the quarter.
Acquirers spent $15.4B on software businesses in Q2, more than three times the $4.7B spent in Q1. Note, though, this includes Oracle’s $6.2B bid for PeopleSoft, as well as PeopleSoft’s $1.4B bid for J.D. Edwards. The median software M&A multiple grew 9% to 1.2x. However, strategic acquisitions continued to yield valuations considerably in excess of the median.
In summary, financial buyers reentered the market seeking sound investment opportunities for realistic prices. Industry consolidation among enterprise players, long predicted, became more of a reality, and strategic buyers seeking competitive differentiation, new markets and accelerated growth shopped aggressively and paid higher multiples. We expect these trends to continue for the remainder of the year and remain confident in our forecast of a 10% increase in software M&A for 2003.
ECONOMY
After 10 very difficult quarters, Q2 provided reason for guarded optimism about the nation’s economic outlook. The technology sector led a sustained and impressive stock market rally. Improved earnings reports, smaller inventory reserves, continued Fed rate cuts and an aggressive fiscal policy were the catalysts many investors needed, choosing to ignore several negative indicators including an escalating unemployment rate. Investors also seemed comforted by a more stable geopolitical picture, but major challenges in post-war Iraq, the “road map” in Israel and the Palestinian territory and a new peacekeeper role in Liberia, loom as potential spoilers. Through June 30, the S&P 500, NASDAQ and Dow are up 11%, 20% and 8% respectively (see Figure 1). For the quarter, these same indices are up 15%, 20% and 12%. Relative to October 2002, they’ve increased 25%, 45% and 23%, respectively.
Figure 1: Q1 2003 Major Market Indices
A significant number of economists are now predicting the U.S. economy will rebound in the second half of the year from a lethargic Gross Domestic Product (GDP) growth rate of 1.4% (see Figure 2) to a far healthier 3% to 3.5% rate, which historically has connoted long-term growth. The Conference Board’s leading index of 10 economic indicators, which have traditionally marked turning points in the U.S. economy, increased 1% in May, the biggest increase in 17 months. Specifically, the index recorded improvements in real money supply, consumer confidence, weekly initial claims for unemployment, building permits and manufacturers’ new orders for consumer
goods and materials.
Figure 2: U.S. Gross Domestic Product (GDP)

In line with the broader market, the average market value of the SEG-SEVENTY, our software industry public company index, climbed 10% during the quarter, following a 14% increase in Q1 (see Figure 3). Interestingly, the median revenue multiple grew 15% to 2.1 times trailing-twelve-month (TTM) revenue, while the median PE fell 16.3% to 28.7x, indicative of earnings growth exceeding market growth. For the SEG-SEVENTY, the median multiple of EBITDA was 18.6x. The average revenue multiple for the portfolio was 2.7x, and the corresponding confidence interval at eighty percent was 2.4x to 3.0x.
The markets disproportionately rewarded the industry’s largest players – those public software companies with the greatest revenue and earnings. The median revenue multiple for the 23 companies in the SEG-SEVENTY with revenue between $200M and $1B was 2.2x, but only 1.8x for those with revenue below $200M.
Valuations by software sector continued to vary widely, as they have over the past 10 quarters. Q2 median revenue multiples by sector were:
Business Intelligence (BI), 2.5x
CAD/CAE, 2.2x
Customer Relationship Management (CRM), 1.5x
Developer Tools (DT), 3.0x
Enterprise Application Integration (EAI), 2.3x
Enterprise Resource Planning (ERP), 1.6x
Information / Data Management (IM), 1.9x
Security, 2.8x
Supply Chain Management (SCM), 2.0x
The CRM sector of the SEG-SEVENTY, comprised of 13 companies, saw the largest increase in valuation, growing 40% in Q2. Security software companies grew 15% after declining in Q1. Software companies specializing in developer platforms and productivity tools, such as BEA Systems, Borland and Mercury Interactive, continued to lead in valuation, but declined 4% to 3.0x.
Figure 3: SEG-SEVENTY Median Multiples by Sector

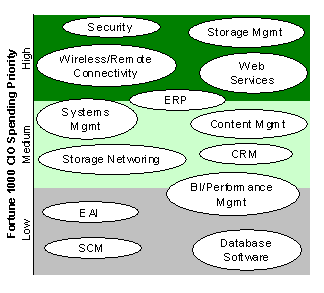
Despite improved earnings and a healthier economic climate, IT spending, an important barometer for sustained tech sector growth, remained lackluster. April and May spending surveys by UBS Securities and Goldman Sachs showed deterioration, with UBS estimating 1% year-over-year growth in IT spending, and Goldman Sachs reducing their estimate from 1% to –3.2%. However, a June report from Goldman Sachs is more optimistic, indicating a rebound in IT spending from –3.2% to –0.4% for the year and 6% growth for 2004. Security and storage management remain high on the priority list (see Figure 4).
Figure 4: CIO Software Spending Priorities
CIOs are insisting on greater ease of application integration and lower cost of ownership. In particular, CIOs are pressing for lower license and maintenance fees which could imperil software company operating margins and profitability, key valuation criteria.
MERGERS & ACQUISITIONS
Software industry M&A activity in the second quarter was driven by three disparate buyer types reflecting very different motives: Larger companies seeking to eliminate competition; private equity firms seeking to take undervalued public companies private; and strategic buyers seeking competitive differentiation, new markets and accelerated growth. These same buyer types and deal motives will undoubtedly characterize software industry M&A in H2.
Industry Consolidation
Industry consolidation took on new meaning in Q2, as Oracle launched its hostile bid for PeopleSoft, closely following PeopleSoft’s friendly bid for J.D. Edwards. Increased competition, stagnant Fortune 1000 IT spending and bargain valuations have spurred acquisitions aimed at eliminating competition and aggressively expanding into the mid-market. After a dearth of mega-mergers in the past two years, we expect additional big deals to follow closely on the heels of Oracle/PeopleSoft/JDEC in H2, now that the pot has been stirred. Look for IBM, among others, to react. Some believe Oracle would seek to replace IBM’s DB2 at many enterprises which now use the database with their PeopleSoft and J.D. Edwards solutions.
Private Equity Buyouts
Private equity firms continued their shopping spree in Q2, seeking undervalued software companies to take private. While some are turnaround opportunities available at bargain basement prices, others are small, reasonably healthy public companies that are suffering from stagnant growth, Sarbanes-Oxley and the inability to raise additional capital. Most of the latter have solid revenue and decent profitability, but little sex appeal. The plan: take them out of the limelight, reduce overhead, build revenue both organically and through consolidation, then roll them out again when the IPO market returns. In Q2 alone, we identified more that a dozen such acquisitions by private equity buyers, including:
Battery Ventures / Made2Manage Systems
Cerberus Capital Management and General Atlantic Partners / Baan
Gores Technology Group / Resonate
Platinum Equity Holdings / Tanning Technology
Saratoga Partners / Divine’s Managed Services Unit
Vector Capital / Corel Corp.
Strategic Acquisitions
Strategic acquisitions continued to be a primary M&A driver in Q2. Buyers primarily sought and bought small/midcap companies, many of them private, with complementary products that could significantly enhance the buyer’s offering or reach. Most buyers continued to stick close to home, seeking companies in the same sector. With few exceptions, the acquired companies were typified by solid financials, strong brand identity, a plethora of customers and the potential for providing the buyer with immediate incremental revenue and earnings. Looking forward, principal acquisition targets will continue to be software companies that leverage buyers in the small/medium business market, as well as such key vertical sectors as finance, government, utility and energy. Not surprisingly, strategic valuations led, by far, industry valuations and going private valuations.
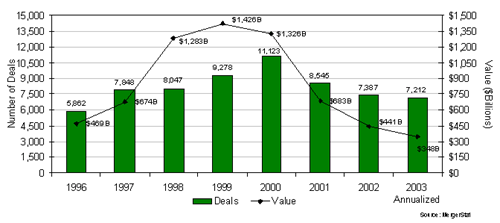
Figure 5: U.S. Merger & Acquisition Activity
M&A: The Numbers
Relative to the first quarter, total U.S. M&A activity increased 31% and dollar value was up 38%. At the current run rate, 7,212 deals will close in 2003 for an aggregate of $348B (see Figure 5). M&A activity in the software industry continues to lead all other sectors. Software accounted for 300 deals in Q2, approximately 15% of all U.S. M&A activity for the quarter (see Figure 6).
Figure 6: U.S. Sector-Specific M&A Activity
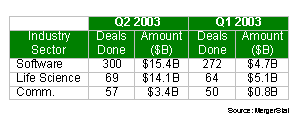
Acquirers spent $15.4B on software businesses in Q2, more than three times the $4.7B spent in Q1. Note, though, this includes Oracle’s $6.2B bid for PeopleSoft, as well as PeopleSoft’s $1.4B bid for J.D. Edwards.
The median software M&A multiple grew 9% to 1.2x. However, strategic acquisitions continued to yield valuations considerably in excess of the median. Example transactions include:
Medical Systems / Triple G Systems Group, 3.1x
Jupitermedia / ArtToday.com, 2.7x
Kofax Image Products / Mohomine, 6.0x
Mercury Interactive / Kintana, 5.1x
NDC Health Corp. / TechRx, 4.4x
ScanSoft / SpeechWorks International, 5.0x
Symantec / Nexland, 2.5x
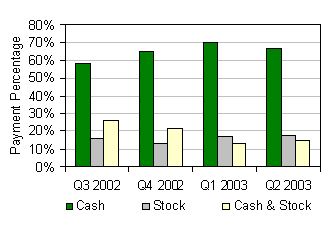
No surprise, cash remains king. Cash continues to be the preferred acquisition currency, with many buyers still believing their stock is undervalued (see Figure 7). 67% of buyers in Q2 used cash – down from 70% in Q1. 18% of buyers in Q2 paid all stock, and 15% used a combination of the two.
Figure 7: Software M&A – Form of Payment
M&A: Most Active Software Sectors
Systems/app management, ERP, accounting/financial and supply chain management were the most active categories in Q2.
|
|


|

