|
|
| Home - Software M&A Review - Oct 03 Issue |
Software M&A - Q3 Review |
By Ken Bender, Managing Director, and Allen Cinzori, Vice President - Software Equity Group, LLC
ECONOMY
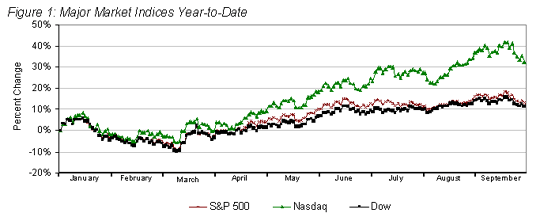
The economy continued to show signs of recovery in Q3, as stock market indices, public company valuations and economic activity barometers all improved. The S&P 500, NASDAQ and Dow slowed and stumbled a bit, but still closed up 2%, 10% and 3% in Q3. Year-to-date, the S&P 500, NASDAQ and Dow are up 13%, 33% and 11%, respectively (Figure 1). And what a difference a year makes. Relative to October 2002, these indices increased 28%, 60% and 27%, respectively.
Most encouraging was the unexpected growth in Gross Domestic Product (GDP). Rather than the 1.4% GDP increase that was predicted, Q2 GDP came in significantly higher at 3.3%. Economists are now anticipating an even healthier third quarter, with GDP estimated to improve by 5% (Figure 2). Another respected economic barometer, The Conference Boards index of ten leading economic indicators, continued upward in Q3, advancing 0.6% in July and 0.4% in August. The CB index is up 2.5% from its March low further evidence of a strengthening economy in H2.

Investors and economists were also encouraged by Septembers employment figures which show businesses adding jobs for the first time in eight months. Nevertheless, only some 57,000 jobs were added and the U.S. unemployment rate remained at 6.1%, after declining from a 2003 high of 6.4% in June 2003.
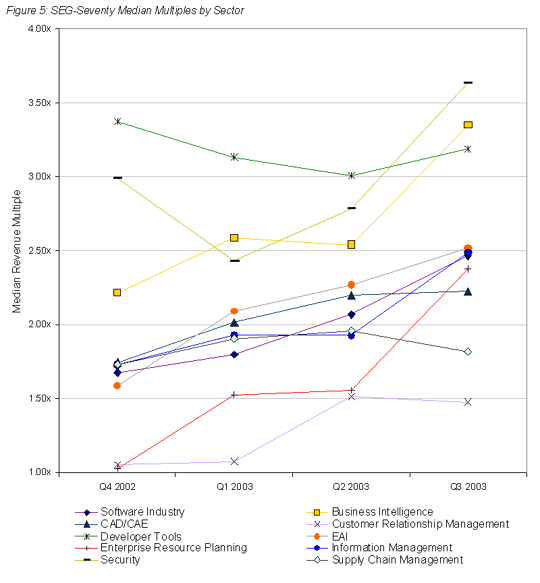
The software industry generally kept pace with the broader market. The average market value of the SEG-SEVENTY, our index of public software companies, climbed 19% in Q3, on the heels of a 10% increase in Q2 (Figure 5). Other major Q3 market indices for the SEG-SEVENTY:
Median revenue multiple for the group grew 17% to 2.5 times trailing-twelve-month (TTM) revenue
Median PE climbed 14% to 33.1x
Median multiple of EBITDA was 21.0x
Average operating profit margin before depreciation, interest and taxes was 16.7%
Average revenue multiple for the SEG-SEVENTY was 3.1x, and the corresponding confidence interval at 80% was 2.8x to 3.5x.
Measuring enterprise value (adding debt and deducting cash and cash equivalents) the median EV to TTM revenue ratio was 1.7x.
The markets continued to disproportionately reward the industrys largest players those public software companies with the greatest revenue. For the 21 software companies in the SEG-SEVENTY with revenue between $200 million and $1billion, the Q3 median revenue multiple, a key valuation measure, was 2.6x, but only 2.3x for those with revenue below $200 million. Companies with revenue in excess of $1 billion, however, boasted a median revenue multiple of 4.3x in Q3. The difference is even more startling on a PE basis. Companies with revenue between $200 million and $1 billion were valued at a median PE of 42.3x versus 30.2x for those with revenue less than $200 million.
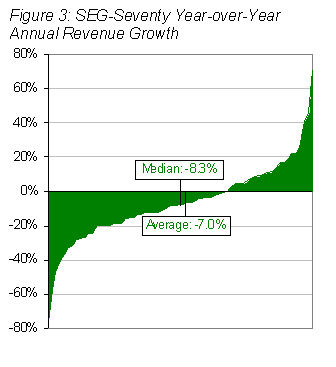
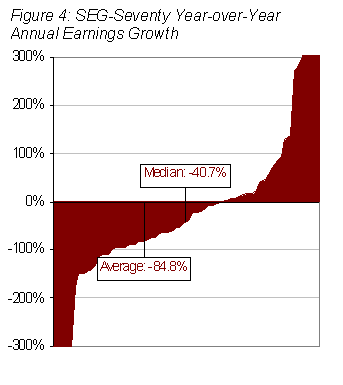
Investors, buoyed by signs of improvement in the general economy, justified the run-up in public software company stock prices and valuations by claiming public software companies are currently undervalued "if the market fully recovers." Perhaps. But the present reality doesnt support the run-up. Despite an improved economy, software company revenues continue to decline. And despite nearly three years of cost cutting, software company earnings are faring even worse. During the past twelve months, median revenue of the SEG-SEVENTY actually declined 8.3%, and median earnings fell a whopping 40.7% (Figures 3 and 4).
Looking forward, IT spending, an important barometer for improved tech sector growth, is expected to improve in 2004 according to recent IT spending surveys by Goldman Sachs and Gartner. Goldman forecasts a 2.3% increase over 2003. Merrill Lynch remains slightly less optimistic, predicting improved growth in late 2004, or 2005.
Software sector focus remains a key determinant of public software company valuation, as it has for the past three years. However Q3 showed marked change in certain sector valuations. All sectors, with the exception of Supply Chain Management and Customer Relationship Management, showed improvement over Q2. SEG-SEVENTY median revenue multiples by sector for Q3 were:
Business Intelligence (BI): 3.4x
CAD/CAE: 2.2x
Customer Relationship Management (CRM): 1.5x
Developer Tools (DT): 3.2x
Enterprise Application Integration (EAI): 2.5x
Enterprise Resource Planning (ERP): 2.4x
Information / Data Management (IM): 2.5x
Security: 3.6x
Supply Chain Management (SCM): 1.8x
The ERP sector of the SEG-SEVENTY, comprised of seven companies, saw the largest increase in valuation, growing 53% in Q3. We attribute much of this growth to increasingly successful penetration of the small-medium business market, which eluded most of the major ERP players until recently, as well as sector consolidation. Business intelligence, which has morphed into business performance management and caught the attention of enterprise CEOs and CFOs, grew 32% in Q3. Security software moved up 30%, while info/content management increased 29%.
MERGERS & ACQUISITIONS: THE TRENDS
M&A activity increased in Q3, and valuations notably improved in comparison to Q2. The composition of buyers changed, a predictable by-product of higher stock prices and market valuations. With fewer undervalued, high-potential companies ripe for the picking, private equity buyers, omnipresent in the first half of the year, retreated from the buyer landscape. More public company buyers stepped into the acquisition fray, seeking to leverage their higher priced stock as currency. Most stayed close to home, seeking new customers, enhanced product functionality and access to the small/medium business markets. Still, some interesting new trends began to emerge in Q3. Technology buys, particularly in the mobile and wireless arenas, reappeared after a long hiatus. And a surprising number of buyers signaled their willingness to venture into new markets, product lines and technologies.
Industry Consolidation
Industry consolidation among larger public companies, which some predicted would become the next M&A tsunami, stalled, right along with Oracles hostile takeover of Peoplesoft/JD Edwards. There were a few rollups, most notably Chinadotcoms acquisitions of Ross Systems and Industri-Matematik; IMSIs purchase of CADKEY, CADalog.com and assets of Upperspace Corp; and SSA Global Technologies purchase of EXE Technologies.
Private Equity Buyouts
After more than a dozen acquisitions in Q2, private equity firms ended their shopping spree and withdrew from the market. Exceptions were Symphony Technology Group, which added struggling POS vendor GERS Retail Systems, and Thoma Cressey, which bought litigation support services provider Daticon.
Strategic Acquisitions
Most acquisitions in Q3 could be characterized as strategic, yet financial considerations continued to predominate. Buyers sought and bought companies with complementary products and the same target markets. The majority stuck to the now standard formula the acquisition must be able to yield immediate incremental revenue through cross-selling the installed base of each party, and should be accretive immediately or in the near term. The seller should be a close neighbor, rather than direct competitor, as proximity is comforting to all concerned. Q3 examples of this buy your neighbor acquisition strategy include Business Objects/Crystal Decisions, Secure Computing/N2H2, and Lockheed Martin/Titan.
However, a significant number of buyers pursued a very different acquisition strategy in Q3, signaling a subtle shift in software M&A. Technology was their primary objective, but these were not the "technology buyers" of the bubble era. The quest in Q3 was for highly sophisticated, market proven, immediately deployable technology, often comprising an entirely different product category, which would fundamentally extend and improve the user experience when embedded with the buyers offering. Buyer motives ranged from dramatically differentiating from the competition, to extending into a new product category (e.g., Ascential/ Mercator, Hyperion/Brio, Informatica/Striva, Pervasive/Data Junction).
And finally, a surprising number of buyers ventured even farther from home in Q3, seeking to acquire a new line of business, enter entirely new markets, or fundamentally alter their current identity (e.g., Symantec/PowerQuest, NTN/Breakaway, Intuit/IMS, Kodak/PracticeWorks).
Vertical Market Software Companies
Vertical software company acquisitions continued to lead all other software sectors in the third quarter. Niche vertical players were in demand by both larger vertical players seeking to extend their offerings, and enterprise players seeking greater penetration into vertical markets. The health care sector saw the largest number of transactions, including Perot/Vision Health, WebMD/Advanced Business, Quovadx/CareScience, and American Healthways/StatusOne. Government, financial services, and legal sectors also saw multiple acquisitions.
MERGERS AND ACQUISITIONS: THE NUMBERS
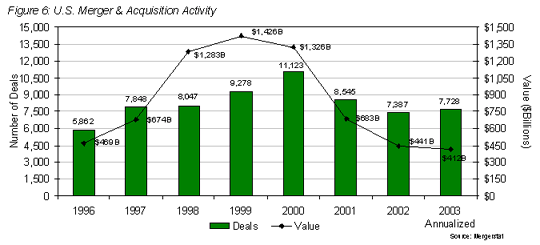
Relative to the second quarter, total U.S. M&A activity for all industry sectors increased 7%, and dollar value was up 34%. At the current run rate, 2003 will see some 7,728 deals, outpacing 2002, with aggregate transaction value exceeding $412 billion (Figure 6).
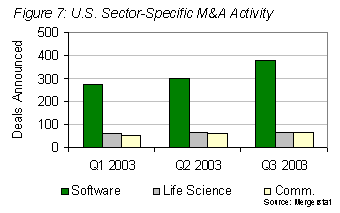
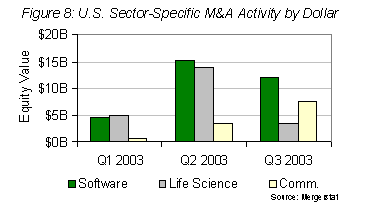
The software industry continues to lead all other industry sectors in M&A activity, accounting for 381 deals in Q3, or 17% of the total. Software transactions in the first three quarters aggregated to 953, approximately 16% of all U.S. M&A activity. Acquirers spent $12.1 billion on software businesses in Q3. (Figures 7 and 8).
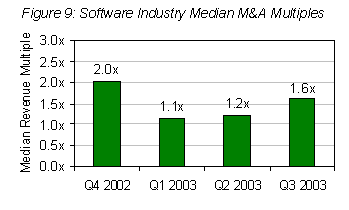
Software industry M&A valuations improved considerably in Q3. As a result of the improving economy and the trends cited above, the median software M&A multiple for Q3, at 1.6x, was a substantial improvement over Q1 and Q2 (Figure 9).
Strategic acquisitions, i.e., transactions deemed by the acquirers to be essential to their future, predictably yielded valuations considerably greater than the median. Examples include:
Pumatech / Synchrologic, 5.1x
EMC / Legato Systems, 4.6x
Intuit / Innovative Merchant Solutions, 4.6x
Kodak / PracticeWorks, 4.2x
Interwoven / iManage, 4.0x
Business Objects / Crystal Decisions, 3.0x
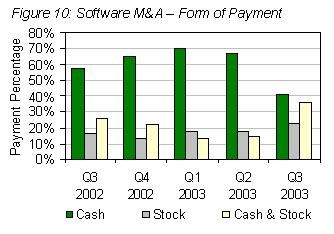
Q3 also saw significant changes in the preferred form of deal consideration (Figure 10). With stock prices higher, larger public companies no longer considered their stock too undervalued to use as currency. Smaller public companies, with little cash remaining on their balance sheets, but higher stock prices, also convinced sellers to accept more stock. As a result, 42% of buyers in Q3 used cash down from 67% in Q1. 23% of buyers in Q3 paid all stock (vs. 18% in Q2), and 35% used a combination of the two (vs.15% in Q2).
M&A: Most Active Software Sectors
M&A activity spread to greater number of sectors in Q3. Supplementing the usual array of security software deals were multiple transactions in systems, application and network management, imaging and content management, wireless and synchronization, ERP and vertical apps.
The most active software sectors in Q3, including representative transactions:
Business Intelligence
Business Objects / Crystal Decisions
Hyperion / Brio
Knightsbridge Solutions LLC / BASE Consulting Group
Interactive / Allerez (select assets)
Lawson Software / Numbercraft
Developer Tools / Utilities
Actuate / Nimble Technology
Hewlett-Packard / Talking Blocks
Jupitermedia / DevX.com
Neoware Systems / Pericom Software
Pervasive Software / Data Junction
SCO Group / Vultus
Speedware / Neartek (select assets)
Sun Microsystems / CenterRun
Enterprise Resource Planning
Chinadotcom / Ross Systems
Epicor Software / ROI Systems
The Sage Group / Timberline Software
Security / Internet Protection
Alpha Virtual / Veridicom
BeTRUSTed / Baltimore Technology (select assets)
Hewlett-Packard / Baltimore Technology (select assets)
Secure Computing / N2H2
SecureD Services / Vasco (select assets)
Symantec Corp. / Nexland
Zix / Elron Software
|
Storage Management
Applied Micro Circuits / JNI
EMC / Legato Systems
Storability / ProvisionSoft (select assets)
Symantec / PowerQuest
Supply Chain Management
Chinadotcom / Industri-Matematik
Epicor Software / TDC Solutions
IntelliTrans / RADSS Technologies
SSA Global Technologies / EXE Technologies
Wireless Software
ACE*COMM / i3 Mobile
Infowave Software / Sproqit Technologies
NVIDIA / MediaQ
Pumatech / Synchrologic
Pumatech / Spontaneous Technology
Symbol Technologies / Covigo
TSI Telecommunication Services / Brience
Q3s Most Active Vertical Healthcare
Allscript Healthcare Solutions / RxCentric
American Healthways / StatusOne Health Systems
Cerner / BeyondNow Technologies
Eastman Kodak / MiraMedica
Eastman Kodak / PracticeWorks
Fair, Isaac and Company / Diversified HealthCare Services
Plexis Healthcare Systems / Logical Claim Solutions
Quovadx / CareScience
Zix / PocketScript
|
|
|


|


