|
|
| Home - Software M&A Review - May 06 Issue |
Software M&A – Q1 2006 was The Best Since '99
continued... page 4 |
Mergers and Acquisitions: The Numbers
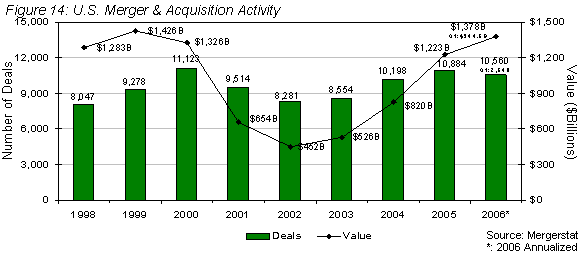
The M&A momentum of 2005 carried over to the first quarter of 2006, with healthy increases in deal volume and dollars spent. Domestic M&A activity across all industry sectors in the first quarter totaled 2,640 transactions with an aggregate purchase price of $345 billion (Figure 14). The total number of deals in 1Q06 increased 32.9% from 1Q05, while total M&A dollars increased 41.8% over the same time period.

 Software represented 16.1% of total M&A deal activity in 1Q06, leading all other industry sectors as in quarters past. There were 426 software transactions, a 14.8% increase over 1Q05's tally (Figure 15). In terms of total M&A dollars spent, the software sector placed eighth with $13.7 billion – well behind first place communications (Figure 16). Software represented 16.1% of total M&A deal activity in 1Q06, leading all other industry sectors as in quarters past. There were 426 software transactions, a 14.8% increase over 1Q05's tally (Figure 15). In terms of total M&A dollars spent, the software sector placed eighth with $13.7 billion – well behind first place communications (Figure 16).
The median valuation of software industry M&A transactions (based on TTM revenue and the seller's equity value) continued to advance in 1Q06 (Figure 17). 2005's median software company M&A valuation of 2.6x TTM revenue climbed to 2.8x in the first quarter and showed few signs of abating.
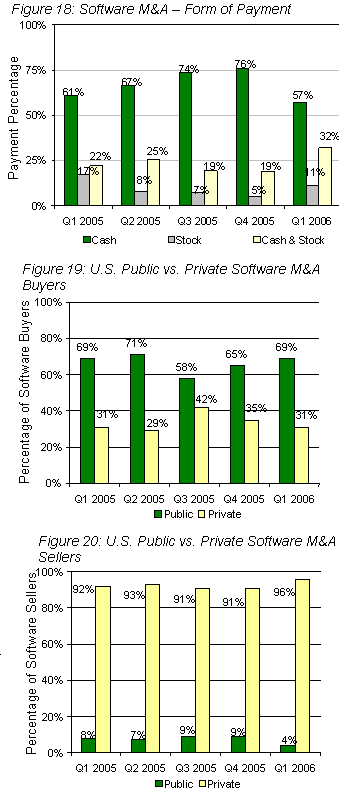
Cash continued to be the preferred deal currency in 1Q06, but a resurging NASDAQ and tech sector boosted the attraction of stock (Figure 18). In the first quarter, 57% of software transactions were all cash, down markedly from 76% in 4Q05. In 1Q06, 32% used a combination of cash and stock as deal consideration, and 11% were all stock.
There were a noteworthy number of private buyers of software companies in 1Q06, a trend that is now in its third year. During the past two years, 34% of all acquirers were private. In 1Q06, private buyers accounted for 31% of all software M&A transactions, a decline from 4Q05's 35%, but still indicative of the market's changed buyer mix (Figure 19 and 20). Venture capitalists, private equity firms and venture-backed private companies were all quite active, occasionally paying public buyer strategic multiples to acquire private and public software companies that satisfied their investment criteria. Far more often, though, financial buyers adhered to their value pricing models, insisting on large, proven markets with huge potential and offering at or below market valuations. Many sought "platform" software companies, usually with revenue of $10 million to $100 million, a compounded annual growth rate of 25% or better, and the capacity to grow tenfold in five to seven years through rapid organic growth and smaller strategic acquisitions. Others sought private software companies that could add needed product functionality, technology, markets or customers to an existing portfolio company, thereby bettering its IPO prospects or exit valuation.
 The software industry has long used median multiple of trailing twelve months (TTM) revenue to measure M&A valuations. We've been no exception, but for years we've cautioned against using the median deal multiple as anything other than a point of reference – and a misleading one, at that. In Figure 21, we dissect the median software company exit valuation for 1Q06 (2.8x trailing twelve month revenue) to provide greater insight into software company valuation. Our analysis considers the affect on valuation of equity structure (private vs. public company), target market, software product category, and size of buyer and seller. The software industry has long used median multiple of trailing twelve months (TTM) revenue to measure M&A valuations. We've been no exception, but for years we've cautioned against using the median deal multiple as anything other than a point of reference – and a misleading one, at that. In Figure 21, we dissect the median software company exit valuation for 1Q06 (2.8x trailing twelve month revenue) to provide greater insight into software company valuation. Our analysis considers the affect on valuation of equity structure (private vs. public company), target market, software product category, and size of buyer and seller.
As a first step, we separated public and private software company sellers to ascertain any disparity in exit valuation. Unsurprisingly, the disparity was significant. Using the software M&A transactions we were able to ascertain revenue multiple for, public company sellers accounted for 15% of all software M&A transactions in 1Q06 and had a median exit valuation of 2.0x TTM revenue. Private company sellers accounted for 85% of all transactions during the same period and had a median selling price of 3.0x TTM revenue. This starkly contrasts what we reported in our 2005 Annual Report, which showed public sellers (24%) having a valuation of 2.8x TTM revenue and private sellers (76%) having a valuation of 2.4x TTM revenue over 2004 and 2005. Why the difference?
First, we have cut our sample size from eight quarters to one, which allows for short-term aberrations that may not be trends. As important, 1Q06 transactions included a greater number of undervalued or distressed OTC and foreign public companies, a blip that will not likely become a norm.
Next, we separated software company sellers specializing in vertical markets (e.g. retail, financial services, telecom, manufacturing, etc.) from those companies with horizontal software solutions. In 1Q06, 23% of software company sellers were focused on a vertical market and yielded a median 2.5x TTM revenue valuation. Those sellers offering a horizontal solution represented 77% of software M&A activity in the first quarter and yielded a 3.0x TTM valuation.
|
|


|

