|
|
| Home - Software M&A Review - Aug 06 Issue |
Software M&A - Q2 Review |
By Ken Bender and David Legacki, Software Equity Group, L.L.C.
 U.S. Economy: Software Industry Macroeconomics U.S. Economy: Software Industry Macroeconomics
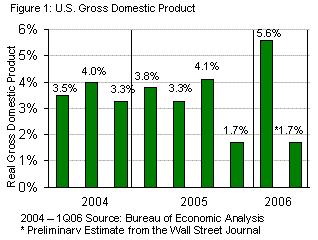
Despite continuing crude oil price increases and growing inflation concerns, the U.S. economy continued to improve in the second quarter of 2006, albeit at a markedly slower pace than 1Q06. Gross Domestic Product (GDP), a key economic indicator and broadest measure of economic activity, is projected to grow at a lackluster annualized rate of 1.7% in 2Q06, but follows on the heels of 1Q06’s GDP of 5.6%, the fastest pace of growth since the economy grew 7.2% in the third quarter of 2003 (Figure 1). According to a midyear survey of 56 forecasters by The Wall Street Journal, economists are cautiously projecting 3.0% GDP growth in 3Q06. Personal consumption, exports, private investment, equipment and software expenditures, and federal government spending are cited as the key drivers. According to the U.S. Department of Commerce, equipment and software spending, a component of GDP that is primarily IT related, was a major contributor to the GDP growth in 1Q06. Equipment and software spending for 1Q06 increased 14.8% over 4Q05.
The Conference Board’s index of leading economic indicators, which gauges the economy’s likely performance over the next three to six months, paints a less optimistic picture. Only three in ten indicators that comprise the leading index increased in May. The positive contributors – beginning with the most positive contributor - were manufacturers’ new orders for nondefense capital goods, manufacturers’ new orders for consumer goods and materials, and interest rate spread. The negative contributors – beginning with the most negative – were average weekly initial claims for unemployment insurance (inverted), index of consumer expectations, real money supply, average weekly manufacturing hours, building permits, stock prices, and vendor performance.
Committed to keeping inflation at bay, the Federal Reserve stayed the course and raised the Federal Funds rate 25 basis points to 5.25% at the end of 2Q06, up from 3.25% at the end of 2Q05. The number of unemployed (7.0 million) and the nation’s unemployment rate (4.6%) remained relatively unchanged from 1Q06 to 2Q06. The unemployment rate has been steadily decreasing for the past few years. It is markedly lower than the 5.0% and 5.6%, reported over the same period for the second quarter of 2005 and 2004, respectively.
Public Markets and Public Software & Internet Company Performance
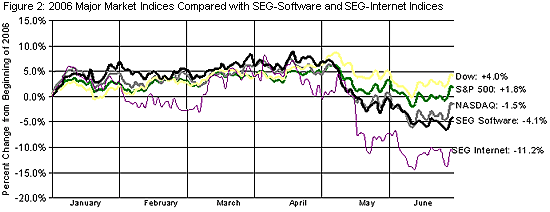
After a strong first quarter, public markets retreated in 2Q06, reflecting investor uneasiness with macroeconomic factors. The S&P 500 and tech heavy NASDAQ, after ending 1Q06 with gains of 3.7% and 6.1%, respectively, lost their footing in 2Q06, posting quarterly losses of 1.9% and 7.6%, respectively, following the first quarter. For the year, the S&P 500 is up 1.8% while the NASDAQ is down 1.5% (Figure 2).
New SEG Tracking Indexes For Public Software and Internet Companies
In response to requests from our clients and subscribers, we have greatly expanded our public software company tracking index which took effect last quarter. Our former index, the SEG-100, was comprised of 109 companies in 17 principal product categories. Our new SEG Software Index became effective January 1, 2006 and is comprised of 262 public software companies in 27 distinct product categories. We’ve also added a second new tracking index, the SEG Internet Index, comprised of 26 public companies in 4 distinct categories. The SEG Software Index and SEG Internet Index will facilitate even greater software industry micro- and macro-analysis, and will enable our readers to glean additional insight about industry trends and industry subsector financial performance.
Public Software Company Performance
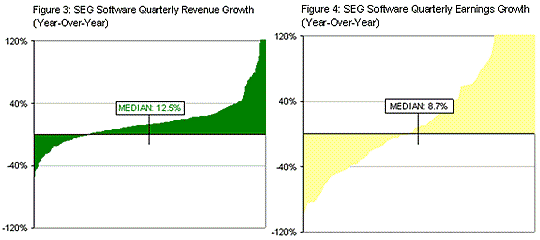
Public software company financial performance continued to improve in the second quarter, but it wasn’t enough to satisfy investors. Median revenue of the 262 software companies comprising the SEG Software Index grew 12.5%, and median earnings grew 8.7%, over the same quarter a year ago (Figures 3 and 4).
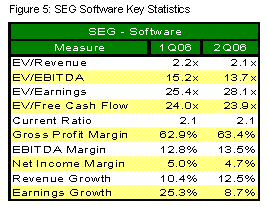 However, on a quarter-over-quarter basis, median public software company valuations (enterprise value to revenue multiples) fell from 2.2x in 1Q06 to 2.1x in 2Q06, a trend consistent with the broader market indexes. Other key financial performance measures for the SEG-Software Index are enumerated in Figure 5.
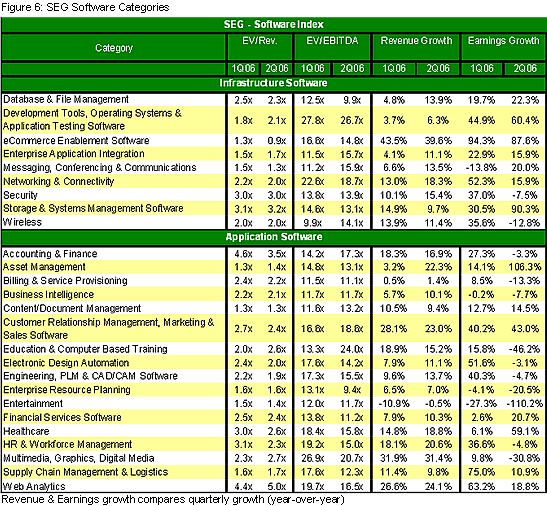
As in past quarters, the financial performance of public software companies in 2Q06 varied widely by software product category (Figure 6).
|
|

