|
|
| Home - Software M&A Review - Aug 06 Issue |
Software M&A - Q2 Review
continued... page 2 |
Relative to 2Q05, providers of eCommerce enablement software (Art Technology Group, Cybersource, Immergent, Optimal Group, et al.) and multimedia, graphics & digital design (Adobe, Avid Technology, Bitstream, InterVideo, Loudeye, et. al.) led all other software categories in 2Q06 revenue growth (+39.6% and +31.4%, respectively), while software companies providing solutions for entertainment (-0.5%), billing & service provisioning (+1.4%) and development tools, operating systems and application testing software (+6.3%) continued to lag far behind. As for earnings, vendors of asset management software led all other categories, reporting an average 2Q06 earnings increase of 106.3% over 2Q05, while entertainment software companies declined 110.2% in median earnings over the same time period.
Investors are holding public software companies accountable as never before, demanding top line growth, particularly from new licenses and/or subscriptions. At the same time and more so than ever, investors are clamoring for sustained, quarter-over-quarter increases in earnings and profitability, with special emphasis on EBITDA. Public software companies that fail to both grow revenue and generate significant free cash flow and EBITDA returns should see little if any increase in valuation in the coming quarters. Those that exceed expectations can expect to be rewarded, 2Q06 illustrates this well: the median EV/Revenue multiple for SEG Software Index companies posting a profit in 2Q06 was 2.6x, but only 1.4x for those reporting losses.
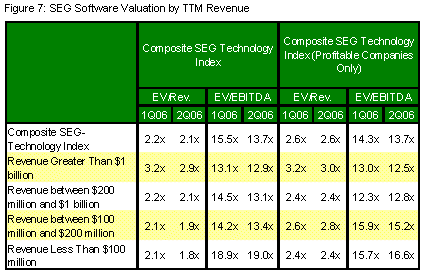
 Consistent with prior quarters, 2Q06 demonstrated size continues to matter when it comes to public company software valuations. For the quarter, SEG-Software companies with revenue greater than $1 billion posted a median EV/Revenue ratio of 2.9x, compared to a median ratio of 2.1x for software companies with revenue between $1 billion and $200 million (Figure 7). Consistent with prior quarters, 2Q06 demonstrated size continues to matter when it comes to public company software valuations. For the quarter, SEG-Software companies with revenue greater than $1 billion posted a median EV/Revenue ratio of 2.9x, compared to a median ratio of 2.1x for software companies with revenue between $1 billion and $200 million (Figure 7).
Predictably, companies with revenue between $200 million and $100 million reported a median EV/Revenue ratio of 1.9x, while companies with revenue less than $100 million reflected the lowest valuation, a median EV/Revenue valuation of 1.8x. The bigger is better valuation truism has become a principal driver of software industry M&A activity.
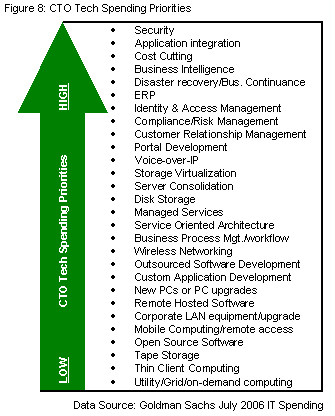
 IT spending continues to have a direct and significant downstream impact on software company financial performance. According to Goldman Sachs’ July IT Spending Survey, IT spending growth for 2006 will be in the healthy 5-7% range. Specific IT spending priorities for 2006 are enumerated in Figure 8. IT spending continues to have a direct and significant downstream impact on software company financial performance. According to Goldman Sachs’ July IT Spending Survey, IT spending growth for 2006 will be in the healthy 5-7% range. Specific IT spending priorities for 2006 are enumerated in Figure 8.
Security remains paramount this year, with identity and access management and intrusion detection/prevention being the highest priorities and web filtering being the lowest security spending priority. Compared to Goldman Sachs February IT Spending Survey, the most improved IT spending categories were business intelligence (up seven spots to #4) and CRM (up 11 spots to #11).
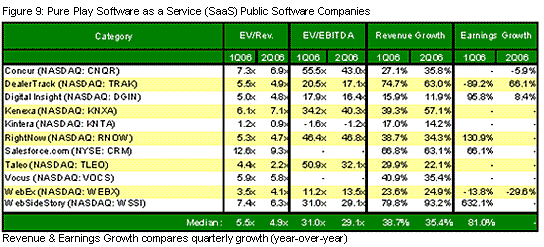
To enable our clients and subscribers to better assess SaaS market adoption and SaaS provider financial performance, we began in our 1Q06 report to separately track pure-play, enterprise focused SaaS providers. Our SaaS index is comprised of 11 public companies (Figure 9), but will expand as additional SaaS pure plays enter the public market.

In 2Q06, SaaS providers continued to outperform the remainder of the software industry, reporting median revenue growth of 35.4% over the same quarter a year ago, considerably outperforming the software industry overall (+12.5%). Similarly, SaaS providers significantly outperformed the software industry in general on an enterprise value to revenue basis (4.9x vs. 2.1x) and enterprise value to EBITDA basis (29.1 vs. 13.7x). Removing Kintera, a clear outlier, these valuation multiples improve to 5.4x and 30.6x, respectively.
|
|

