|
|
| Home - Software M&A Review - Aug 06 Issue |
Software M&A - Q2 Review
continued... page 3 |
Public Internet Company Performance
Though the worlds of software and internet/ecommerce/Web 2.0 are rapidly converging, there are clear distinctions between the two in terms of business model, revenue model, solution deployment and end user requirements. We've opted for the time being to track these major categories separately to enable a more granular analysis of each.
Broadly defined, internet companies are primarily internet based and their solutions are primarily – often exclusively – web deployed. Our Internet Index is comprised of companies that constitute the following four principal categories:
- Advertisers – Companies that provide key elements in the internet advertising arena such as search marketing services, software to host and manage ads and a network of websites that run ads. Representative companies include 24/7 Real Media, aQuantive and SINA.
- Search engines – Companies include Baidu.com, Google, Infospace, LookSmart, MIVA, Sohu.com and Yahoo!
- eCommerce & portals – Companies whose main line of business is conducted over the web. Representative companies include 1-800 FLOWERS.COM, Amazon.com, Bluefly, eBay and Expedia.
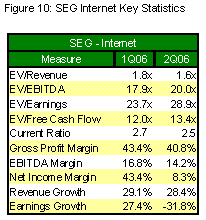
 The 26 companies comprising the SEG Internet Index have had a much more volatile 1H06 than the NASDAQ, S&P 500 and the SEG-Software Index (Figure 2). Key financial performance measures for the SEG-Internet are enumerated in Figure 10. The 26 companies comprising the SEG Internet Index have had a much more volatile 1H06 than the NASDAQ, S&P 500 and the SEG-Software Index (Figure 2). Key financial performance measures for the SEG-Internet are enumerated in Figure 10.
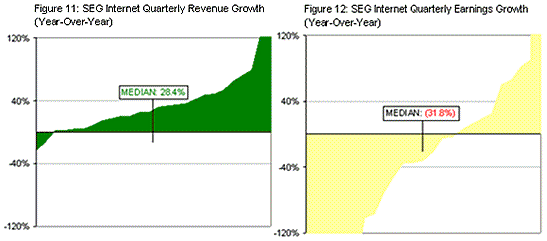
Valuations of most SEG Internet Index companies were depressed much of the second quarter. The median trailing-twelve-month revenue multiple for the group was 1.6x, while median EV/EBITDA and EV/Earnings were 20.0x and 28.9x, respectively. The median current ratio, measured as current assets divided by current liabilities, an indication of a company’s liquidity, was a healthy 2.5x. Median quarterly revenue for the SEG-Internet increased 28.4% compared to 2Q05, while median earnings decreased 31.8% over the same period (Figure 11 and 12).

What is the cause of such a dramatic change in net income growth? Among the many contributing factors are fierce competition and continuing investment in infrastructure, which together have driven up operating costs relative to sales. Enterprise valuations of companies comprising the SEG Internet Index varied widely by internet category in 2Q06 (Figure 13).

Internet-Search Engine posted an impressive 7.6x EV/Revenue valuation, while eCommerce & Portals posted a rather lackluster 1.4x. Most category valuations peaked in April, after lagging for most of the year. Internet-New Media companies, helped by consumers adopting digital content at increasing rates, showed the highest revenue and earnings growth compared to 2Q05.
Mergers and Acquisitions: The Numbers
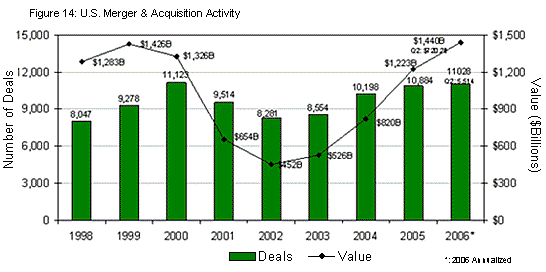
M&A momentum continued to build in 2Q06. At the current rate 2006 M&A deal volume will outpace 2005’s tally. Domestic M&A activity across all industry sectors in the second quarter totaled 2,874 transactions aggregating $376 billion (Figure 14).

|
|

