|
|
| Home - Software M&A Review - Nov 06 Issue |
Software M&A – A Buoyed Q3
continued... page 2 |
Consistent with prior quarters, 3Q06 proved once again that size matters when it comes to public software company valuations. For the quarter, SEG Software companies with revenue greater than $1 billion posted a median EV/Revenue ratio of 3.0x compared to a median ratio of 2.0x for software companies with revenue between $200 million and $1 billion (Figure 7).
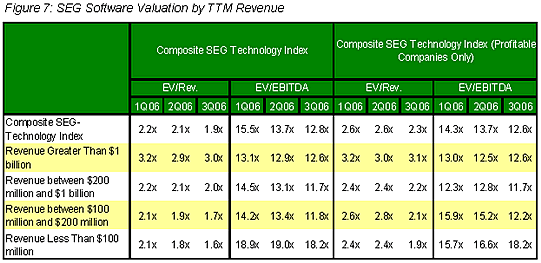
Predictably, companies with revenue between $100 million and $200 million reported a median EV/Revenue ratio of 1.7x, while companies with revenue less than $100 million scored lowest, posting a median EV/Revenue valuation of 1.6x. To enable our clients and subscribers to better assess SaaS market adoption and SaaS provider financial performance, we began with our 1Q06 Report to separately track pure-play, enterprise focused SaaS providers. The SEG SaaS Index is comprised of 11 public companies (Figure 8), but will expand as additional SaaS pure plays enter the public market.
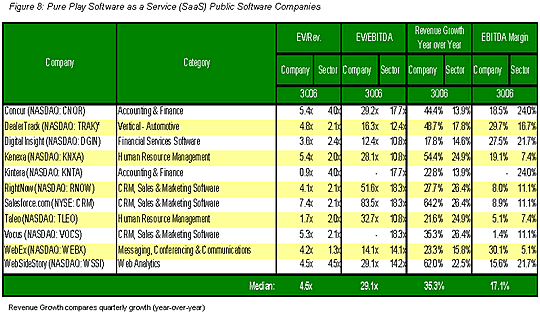
In 3Q06, SaaS providers continued to outperform the remainder of the software industry, reporting median revenue growth of 35.3% over the same quarter a year ago, considerably outperforming the software industry overall (+13.4%). Despite generally higher infrastructure costs and more deferred revenue than their perpetual license counterparts, the median EBITDA margin for SaaS Index companies was 2.5% greater than that of the SEG Software Index. Similarly, SaaS providers significantly outperformed the software industry in general on an enterprise value to revenue basis (4.5x vs. 1.9x) and enterprise value to EBITDA basis (29.1x vs. 12.8x).
Public Internet Company Performance
Though the worlds of software and Internet/e-commerce/Web 2.0 are rapidly converging, there are clear distinctions between the two in terms of business model, revenue model, solution deployment and end user requirements. We've opted for the time being to track these major categories separately to enable a more granular analysis of each.
Broadly defined, Internet companies are primarily Internet based and their solutions are primarily – often exclusively – web deployed. Our Internet Index is comprised of companies whose principal business models fall within one or more of the following categories:
- Advertisers – Companies that provide key elements in the Internet advertising arena such as search marketing services, software to host and manage ads and a network of websites that run ads. Representative companies include 24/7 Real Media, aQuantive, and SINA.
- New media – Companies that provide online information and content. Representative companies include CNET, Jupiter Media, Napster, and WebMD.
- Search engines – Companies include Baidu.com, Google, Infospace, LookSmart, MIVA, Sohu.com, and Yahoo!
- ECommerce & portals – Companies whose main line of business is conducted over the web. Representative companies include 1-800 FLOWERS.COM, Amazon.com, Bluefly, eBay, and Expedia.
The 26 companies comprising the SEG Internet Index have had a much more volatile 2006 than the NASDAQ, S&P 500, and SEG Software Index companies due to notable misses by eBay and Yahoo!, as well as cautious guidance about future growth potential (Figure 2). Key financial performance measures for the companies comprising the SEG Internet Index are enumerated in Figure 9.
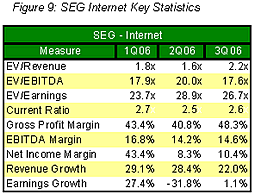
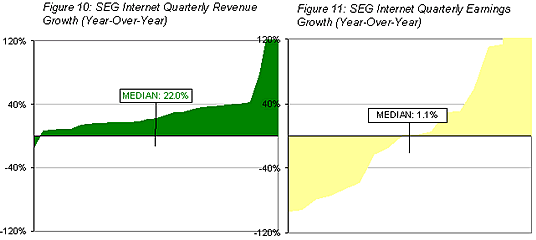
The median trailing-twelve-month revenue multiple for public Internet companies was 2.2x, while median EV/EBITDA and EV/Earnings were 17.6x and 26.7x, respectively. The median current ratio, measured as current assets divided by current liabilities, an indication of a company’s liquidity, was a healthy 2.6x. Median quarterly revenue for SEG Internet Index companies increased 22.0% compared to 2Q05, while median earnings increased 1.1% over the same period (Figure 10 and 11).
Enterprise valuations of companies comprising the SEG Internet Index varied widely by Internet category in 3Q06 (Figure 12).
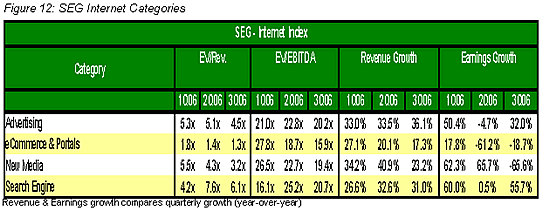
Internet Search Engine posted an impressive 6.1x EV/Revenue valuation, while eCommerce & Portals posted a rather anemic 1.3x. Internet Advertising companies posted the highest 3Q06 year-over-year revenue growth compared to 3Q05 (+36.1%).
Mergers and Acquisitions: The Numbers
M&A momentum continued to build in 3Q06, virtually assuring total M&A deal volume in 2006 will beat 2005’s tally. Domestic M&A activity across all industry sectors in the third quarter totaled 3,074 transactions, aggregating $278 billion (Figure 13).

The total number of deals in 3Q06 increased 22.2% over 3Q05, while total M&A dollars spent increased 29.3% over the same time period.
|
|


|

