|
|
| Home - Industry Article - Jan 03 Issue |
Software IPO Review: 2002 (Copyright 2003, SoftwareCEO Inc.) |
By Bruce Hadley, Founder, SoftwareCEO.com
For software companies struggling through the past year's stagnant
economy, with frozen IT budgets and increased encroachment from
starving competitors, 2002 probably didn't feel like a particularly
positive year. The M&A and IPO metrics, however, point to renewed
health — or at least a return to normalcy, which in our book
is a healthy thing.
IPOs: More activity, more realism
The resurgence of software IPOs began in the last two months of
2001, when five companies went public after a dry spell of only
one IPO in 10 months. In 2002 we saw a steady stream of IPOs, with
a total of 12 software and software services companies choosing
the Wall Street route. May and June were the most active months,
with a total of eight offerings, but 2002 IPO activity was spread
pretty evenly throughout the year.

Despite the relatively small number of software IPOs in 2002 —
it was slow compared to 1999 and 2000, when we logged 57 and 21
software IPOs, respectively — several metrics stand out that
make this past year striking:
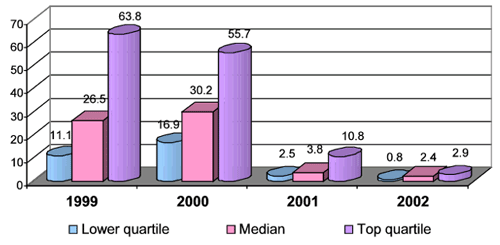
Valuations slumped to 2.4 times revenues at the median,
a 36.8% drop from 2001's 3.8 multiple. While this year's number
pales compared to the 26.5 and 30.2 multiples logged in 1999 and
2000, respectively, it represents a return to realism on the part
of investors. And, that 2.4X is still a half-again richer return
than you're going to get going the M&A route: We've got details
on 191 deals from 2002, and the year's overall median M&A multiple
is hovering around 1.5.
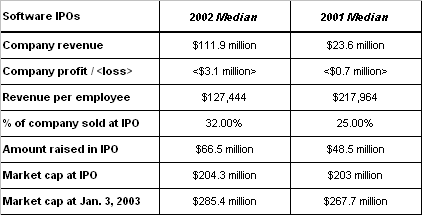
Requirements for entry got much tougher. Not many software
companies are candidates for IPOs, and 2002 offered a sobering reminder
that Wall Street likes a sure thing. This year's typical software
IPO company had revenues $111.9 million, compared to a median of
just $23.6 million in 2001. And, that's just the median: The top
25% were $329.1 million or larger. Profits were promises, for the
most part: The median net income among all IPO companies this year
was a $3.1 million loss, compared to a negative $0.7 million in
2001.
By way of contrast: In those nutty valuation years of 1999 and
2000, the median revenues for software companies going public were
$9.4 million and $11.6 million, respectively. And, if it hadn't
contributed to the $6 trillion lost in the stock market over the
past three years, we'd be laughing about their net incomes: a median
loss of $4.2 million in 1999 and a loss of $5.4 million in 2000.
In short, lots of those 1999 and 2000 IPOs never should have happened.

A stronger market means more cash in the coffers. Interestingly,
even though valuations based on IPO share price quadrupled over
2001, company market caps did not. At the time of IPO, this year's
entries were worth a median $204.3 million, compared to $203 million
in 2001. How could this be? Simple: In the downward spiral of 2001,
initial share prices averaged just $9.50, companies gave up 25%
of their shares outstanding, and raised $48.5 million in their IPOs.
In the somewhat resurgent market of 2002, the average share price
at IPO was $16, companies sold a 32% slice, and raised a median
$66.5 million — a 37% jump.
Services are sexy, software is not. More proof
that that the most successful software companies will transform
themselves into services firms: Seven of the 12 companies choosing
the public path this year — that's 58.3% of them — earn
the majority of their revenues from IT services rather than software
licenses. Of the remainder, four are what we consider "pure"
software companies, and one — portal builder Plumtree
Software (Nasdaq: PLUM) — has centered its business
around the Web.

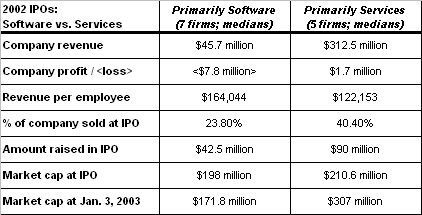
The stats in the table above show some fascinating differences
between software and services companies, and what it takes for each
type to go public. Note that software companies can go public sooner
(though $45.7 million is still about double what we used to figure
in the "good" old days), and they're forgiven a pronounced
lack of profits. When it comes to share price, however, they suffer:
$10 versus $16.50 at IPO. And, the market hasn't stopped pummeling
them: The software-focused companies have seen their share price
increase by 24.7% while their average market cap has declined 13.2%.
The services firms, on the other hand, have enjoyed a median 41.1%
run-up in their stock price, and a 45.8% increase in their market
cap.
|
|


|

