By Ken Bender, Managing
Director, and Kris Beible, Analyst, Software Equity Group, LLC
U.S. Economy: Software Industry Macroeconomics
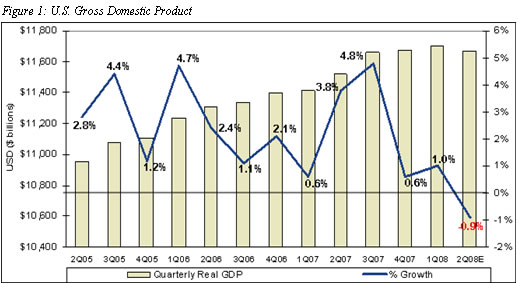
The US economy advanced 1.0% in 1Q08, providing a glimmer of hope given the predicted 0.4% decline. However, preliminary 2Q08 data indicates the economy appears to have finally succumbed to the sub-prime mortgage debacle, $140+ a barrel oil prices, a sharp fall-off in consumer confidence and spending, rising unemployment and inflation concerns. As of our publication date, the 2Q08 GDP growth rate is forecast to decline 0.9% (Figure 1) and many economists believe the final tally will be worse. Yet the Conference Board’s June report optimistically noted a 0.1% increase in the Index of US Leading Economic Indicators. The Conference Board’s index has risen in the past two months, following a steady decline that began in the middle of 2007. The positive contributors, beginning with the largest positive, were interest rate spread, stock prices, manufacturers’ new orders for consumer goods and materials, and manufacturers’ new orders for non-defense capital goods. The negative contributors, beginning with the largest negative, were real money supply, index of consumer expectations, building permits, vendor performance, and average weekly initial claims for unemployment insurance (inverted). Average weekly manufacturing hours held steady in June.
The US Labor Department estimates the unemployment rate rose to 5.5% percent during 2Q08, dwarfing the year earlier jobless rate of 4.6%. The increased unemployment rate was primarily attributable to a continued reduction in non-farm payroll employment, which has fallen by 438,000 since 4Q07. At the end of 2Q08, job losses continued in construction, manufacturing and employment services, while healthcare and mining added jobs. The jobless increase, coupled with persistent housing and credit market turmoil, prompted the Fed to cut the federal funds rate to 2.0% in April, its fourth rate cut in 2008. Over the past two months, the Fed has left the federal funds rate unchanged for the first time since steady rate cuts began in September, as inflation concerns began to overshadow anxiety about the stagnant economy.
Despite the bleak economic outlook, there was a silver lining for software providers. According to a Bureau of Economic Analysis report dated June 26, 2008, software spending, a key GDP subcomponent and important bellwether, advanced 2.6% in 1Q08 from 4Q07 and is up 9.5% year over year. The healthy increase in software spending encouraged buyers and helped sustain robust software M&A activity in 2Q08.
Software IT Spending Projections
It appears the healthy pace of software spending in 1H08 will
continue for the balance of 2008, a trend that bodes well for
both public and private software providers. According to most IT
spending forecasts, domestic IT capital spending will increase
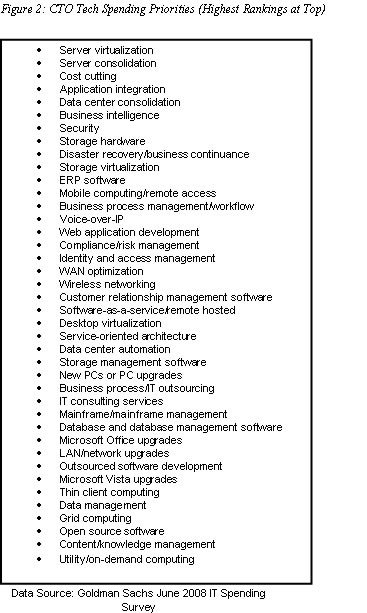
about 5% in 2008, compared to 7% in 2007. According to Goldman
Sachs’ June 2008 IT Spending Survey (Figure 2), server
virtualization, server consolidation, cost cutting measures and
application integration remain high priorities in 2008, while
grid computing, open source software, content/knowledge
management, and utility/on-demand computing spending are low
priorities.
During the past twelve months, Software-as-a-Service (SaaS) has
received a mixed and erratic reception from large enterprise
CIOs. In Goldman’s May 2007 IT Spending Survey, SaaS ranked #35
out of a total of 35 IT capital spending priorities - dead last.
In Goldman’s October 2007 survey, SaaS applications moved
sharply up the list to 18th place, signaling to some pundits a
major breakthrough in enterprise receptivity and adoption of
SaaS solutions. We were more circumspect, citing ongoing
enterprise concerns about SaaS data security, back-office
application integration and relative total cost of ownership in
our 2007 Annual Report (“Why Enterprise SaaS Is No Slam Dunk”).
Subsequently, SaaS dropped back to #28 in Goldman’s February
2008 IT Spending Survey and is currently ranked #21 in the June
2008 survey. While we expect to see growing enterprise adoption
of SaaS in the arenas it has proved most popular - CRM and
workforce management - the jury is still out as to whether large
numbers of enterprises will entrust mission critical tasks to
third party hosts.
Despite healthy IT spending by large enterprise CIOs, it’s
important to remember the aggregate spending increase is less
than in 2007, a reality that may pare the revenue growth of many
public software companies. As important, the historical
preference of enterprise CIOs in North America to delay major IT
purchases until late in the calendar year may pose a challenge
for many public software companies in 3Q08. Since recent data
from Goldman Sachs Investment Research suggests international IT
spending for all 2008 will outpace domestic spending, software
companies with significant non-US revenue sources (e.g.,
Autodesk, Parametric Technology Corp, SAP, Citrix Systems,
Symantec) are likely to fare better than the enterprise software
industry at large in Q3.
Public Software Company Performance
The steady stream of economic bad news, recapped above,
continued to take its toll on the markets in Q2. By the close of
the quarter, the Dow, S&P 500 and NASDAQ had declined 13.0%,
11.6% and 12.1%, respectively, from January 2, 2008 (Figure 3).
The SEG Software Index, our tracking survey of 210 publicly traded software companies, once again closely shadowed the major stock market
indices in 2Q08 (Figure 3).
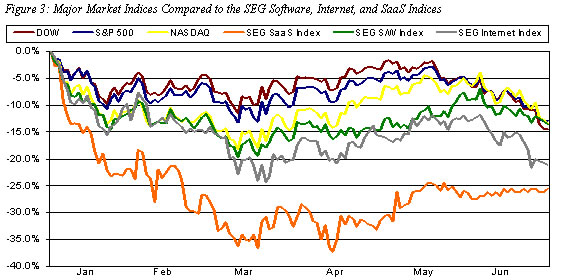
The stock price of
companies comprising the SEG Software Index closed the quarter
down 13.5% from the first trading day of 2008, in line with
other major industries.
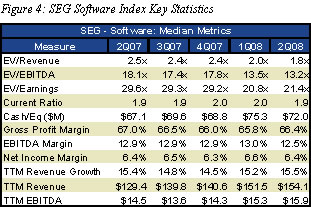
The decline in public software company stock prices took its toll on public software company valuations, as the median revenue multiple fell in 2Q08 to 1.8x from 2.0x in 1Q08, and the median EBITDA multiple dropped to 13.2x from 13.5x (Figure 4).
Defying investor pessimism, public software companies in 2Q08 benefited from the sustained IT spending noted above and continued to
perform well financially. Median
trailing-twelve-month (TTM) revenue of companies comprising the
SEG Software Index increased 15.5% year-over-year, slightly
higher than 1Q08’s 15.2% growth rate (Figure 4). Median EBITDA
margin decreased slightly to 12.5% in 2Q08 from 13.0% in 1Q08.
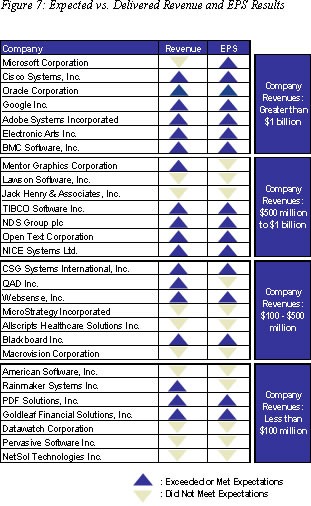
According to our random sample of recent earnings reported by 28
public software companies, a surprising 64% exceeded their most
recent revenue estimates and 57% exceeded their EPS estimates
(Figure 7).
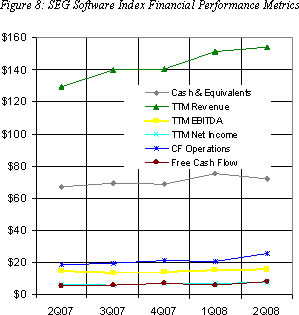
As another indicia of continued good health, public software companies maintained strong balance sheets in 2Q08, posting a median current ratio of 1.9, and median cash and cash equivalents of $72.0 million (Figure 8). The significant cash reserves are another encouraging sign for small- and mid-cap software companies entertaining thoughts of exit. With less pressure from private equity shops and their portfolio companies, and a mission to grow revenue and gain market share in times of lower IT spending, we expect strategic buyers will remain acquisitive for the remainder of 2008.
Investors continued to favor the largest public software companies, finding comfort in size (i.e., annual revenue). SEG Software Index companies with revenues greater than $1 billion posted a median EV/Revenue ratio of 2.8x in 2Q08, compared to a median ratio of 1.6x for software companies with revenue between $100 million and $200 million (Figure 9). Unsurprisingly, while the industry’s behemoths enjoyed substantially
higher EV/Revenue ratios, the same, once again, did not hold
true for EV/EBITDA ratios.
 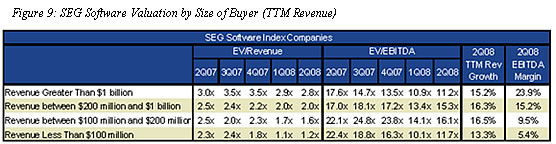
Companies with revenue between $100 million and $200
million were valued at 16.1x e software companies
with revenue greater than $1 billion posted an 11.2x EV/EBITDA
multiple. The differential is unsurprising and historically
consistent. Investors expect smaller companies to be less
profitable as they pump money into R&D and sales, but expect
faster growth. Larger companies, however, are generally expected
to grow more slowly, but generate significant - and ever
increasing - profitability.
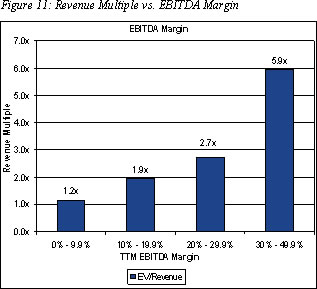
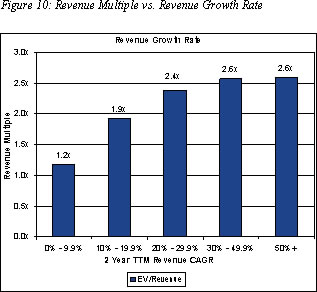
If size matters - and it surely does - what about growth rates?
And what about EBITDA margins? Our analysis of all 210 companies
in the SEG Software Index provided compelling confirmation that
revenue growth and EBITDA margins have a direct impact on market
valuation. The median EV/Revenue multiple of public software companies with two-year compound annual
growth rates (CAGRs) of 30% to 49.9% was twice as much as those
with 0% to 9.9% growth (Figure 10).
The impact growth rates and profitability have on public software company valuations often carries over to the way these public companies value acquisition targets, a reality that has profound exit implications for privately held software companies seeking to exit. As such, sellers need to make conscious choices about whether to drive their companies for growth or profitability.
Public Software Company Performance: By Category
While the software industry’s median valuation multiples (EV/Revenue and EV/EBITDA) are interesting data points enabling ready comparison to other industries, the market valuations of public companies serving specific software product
categories provide far greater insight and guidance about
software industry market trends, changing IT spending priorities
and areas ripe for consolidation.
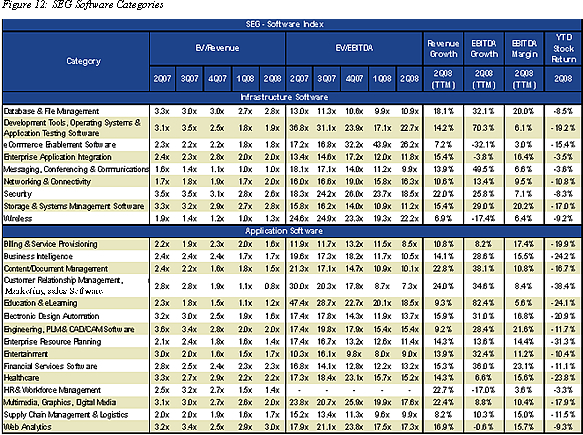
In quarters past, median and earnings multiples varied widely by product category and valuations for the same category often fluctuated widely from quarter to quarter. The second quarter of 2008 proved no exception (Figure 12). By deleting pure-play, enterprise-focused SaaS providers from each product category and including them in our separate SaaS Index, we have corrected the disproportionately positive impact of SaaS providers on the valuations of traditional software providers comprising the balance of the product category, a phenomenon that in the past significantly skewed the median public company valuations for CRM, Marketing and Sales and HR and Workforce Management. To enable a more valid comparison of prior quarters with 2Q08, Figure 12 reflects the deletion of SaaS category companies for prior quarters, as well.
Healthcare, Business Intelligence and Education and eLearning
software providers were all hit hard, as well, with each
category suffering a median YTD stock price decline of more than
23%. On a less negative note, public software companies
comprising our Enterprise Application Integration category,
buoyed by the stock performances of IONA Technologies (+20.9%)
and Sybase (+12.8%), posted a 3.5% YTD stock price decline.
From a category valuation standpoint, only one software company
category, Networking & Connectivity, has seen multiple increase
of its revenue valuation year-over-year from 1.7x in 2Q07 to
2.0x in 2Q08. Software providers in only three categories saw
their EBITDA valuation multiples increase year-over-year:
eCommerce Enablement (26.2x in 2Q08 vs. 17.2x in 2Q07);
Networking & Connectivity (16.3x in 2Q08 vs. 16.0x 2Q07) and
Security (18.5x in 2Q08 vs.18.3x in 2Q07).
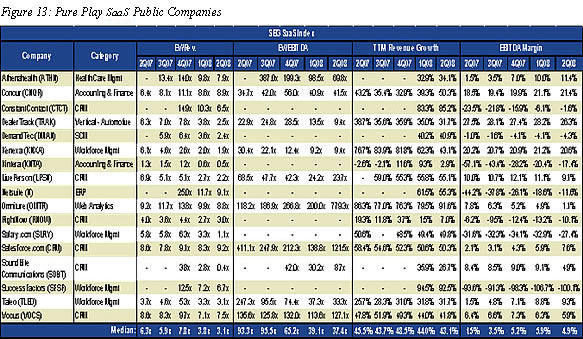
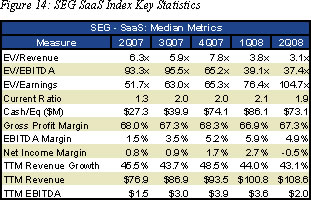
Public Software as a Service Company Performance
In 2Q08, public SaaS providers reported median TTM revenue
growth of 43.1% (Figure 13), markedly outpacing the overall
software industry (+15.5%). Profitability, however, remained
elusive, as these companies continued to invest in
infrastructure, pump money into marketing and sales, and
amortize their subscription-based revenue. The median TTM EBITDA
margin for the SEG SaaS Index was 4.9% in 2Q08, less than half
of the median EBITDA margin of the SEG Software Index. However,
the tide may be turning. The median TTM EBITDA margin of these
SaaS providers has more than tripled from 1.5% a year ago, as
some have begun to find their groove (Figure 14). Nine of these
17 SaaS companies saw their EBITDA margins improve over the past
year, as high infrastructure costs were absorbed, subscription
renewals kicked in and pricing models were refined.
Nevertheless, investors appeared less impressed with public SaaS
providers than in the past. Although investors continued to
favor SaaS providers with markedly higher valuations than
traditional software companies on an EV/Revenue and EV/EBITDA
basis, the valuation premium investors conferred on public SaaS
companies declined by more than 50% in 2Q08 from 4Q07. In times
of economic downturn, investors have historically shown a
decided preference for profitability over revenue growth and
public SaaS company valuations have proven no exception.
|