|
|
| Home - Industry Article - August 08 Issue |
Q2 2008 Software Mergers and Acquisitions: Showing a Healthy Trend
continued... page 2 |
Public Internet Company Performance
Though the software and Internet/ecommerce/Web 2.0 sectors are rapidly converging, clear distinctions remain between the two in terms of business model, revenue model, solution deployment and end user requirements. We've opted for the time being to track these major categories separately to enable a more granular analysis of each. In addition, the SEG Internet Index has been expanded by more than 40 companies in 2008, in order to allow a more robust analysis of this segment and its subsectors.
Broadly defined, Internet companies are primarily internet based
and their solutions are primarily - often exclusively - web
deployed. Our Internet Index is comprised of companies whose
principal business models fall within one or more of the
following categories:
- Advertisers
Companies that provide key elements in the Internet advertising arena such as search marketing services, software to host and manage ads and a network of websites that run ads. Representative companies include InfoSpace, SINA and ValueClick.
- Ecommerce & Portals
Companies whose main line of business is conducted over the web. Representative companies include 1-800 FLOWERS.COM, Amazon.com, Bluefly, eBay and Expedia.
- Financial
Companies that provide online financial services, content and financial information resources. Representative companies include Bankrate, Banks.com, Track Data and Online Resources.
- Networking & Connectivity
Companies, which provide content sharing, testing, measurement and other related services via the Internet. Representative companies include Internap Network Services, iPass, Keynote Systems and Sify Technologies.
- New Media
Companies that provide online information and content. Representative companies include CNET, Jupiter Media, Napster and TechTarget.
- Search Engines
Companies include Baidu.com, LookSmart, MIVA, Sohu.com and Yahoo!
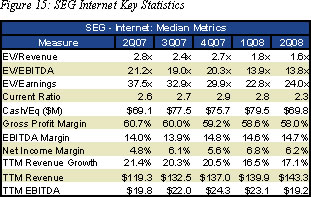
The 62 companies comprising the SEG Internet Index have
experienced slightly higher levels of market volatility
year-to-date than companies comprising the Dow, NASDAQ, S&P 500
and SEG Software indices (Figure 3). The median 2Q08 EV/TTM
revenue multiple for public Internet companies was 1.6x, while
median EV/EBITDA and EV/Earnings were 13.8x and 24.0x,
respectively (Figure 15). The median current ratio, measured as
current assets divided by current liabilities, an indication of
a company’s liquidity, was 2.3, down from 2.8 in 1Q08. Perhaps
as a result, these 62 companies saw their median cash and
equivalents decrease by $10 million in 2Q08. Median 2Q08 revenue
for SEG Internet Index companies increased 17.1% from 2Q07,
while median valuation, measured by EV/Revenue, has decreased
from 2.8x in 2Q07 to 1.6x in 2Q08, perhaps signaling investor
concerns about reduced consumer internet spending.
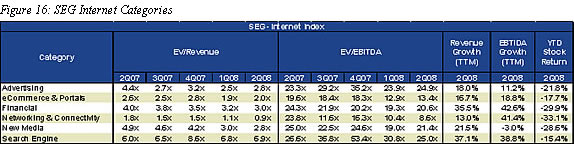
Enterprise valuations of companies comprising the SEG Internet Index varied widely by Internet category in 2Q08, (Figure 16), with Internet Search Engine companies posting an impressive 6.9x EV/Revenue median valuation, up from 6.0x in 2Q07 and networking and connectivity companies posting a 0.9x multiple, down from 1.8x in 2Q07. Internet search engine companies also posted the highest year-over-same quarter revenue growth in 2Q08 (+37.1%), while networking and connectivity companies’ median revenue grew just 13.0% over the same period.
Initial Public Offerings
IPO activity across all industry sectors was predictably
lackluster and virtually non-existent in the software
sector. Investors, clearly shaken by the continuing flood of
bad economic news, have lost their appetite for all, but the
most opportune IPOs. Of the twelve software companies in the
IPO pipeline as of December 31, 2007, only two have gone
public in 2008: ArcSight (NASDAQ: ARST) and RiskMetrics
Group, Inc. (NYSE: RMG) and both listed in 1Q08.
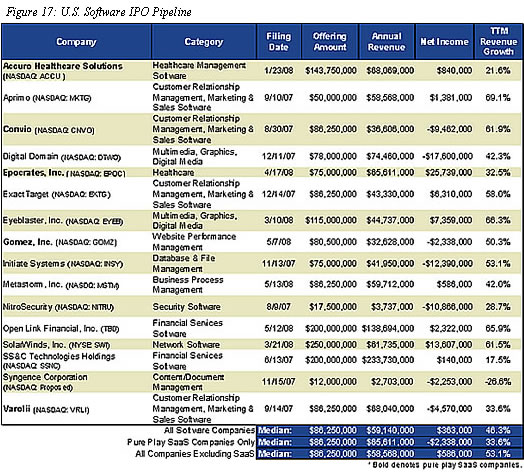
Displaying profound optimism in the face
of overwhelming odds, four software companies filed
S-1’s in 2Q08: rm and Open Link
Financial. To their credit, three of the four are
profitable, with only Gomez (SaaS) in the red. Of the
seven software companies that have filed S-1s in 1H08,
six of the seven are profitable. This marks a stark
contrast to 4Q07, when only one of the five software
companies that filed was profitable and only three of
twelve companies in the IPO pipeline were profitable. We
expect investors, who have historically shown a decided
preference for profitability over growth in bear
markets, will be receptive to these aspiring public
market entrants, provided they maintain solid earnings
and noteworthy growth.
How will the software IPO market fare during the
remainder of 2008? We expect virtually all of the
currently unprofitable pipeline companies will withdraw
their IPOs or allow their filings to lapse current
economic conditions continue or decline. As for mature,
later-stage companies taken private by private equity
investors in hopes of a later IPO, we suspect a few will
test the market in Q4. It will undoubtedly be a much
slower year for software IPOs, likely eight to ten in
aggregate by year end, a ~66% decline in new public
software companies from 2007’s tally of 26.
M&A Deal Volume and Spending: All Industry Sectors
Mergers and Acquisitions: The Numbers
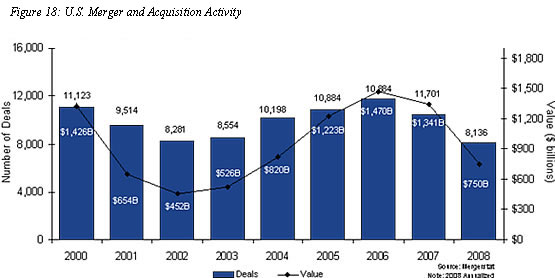
M&A deal volume and M&A spending in North America were virtually flat in 2Q08, compared to 1Q08. The second quarter’s 1,984 deals aggregated $192 billion, on par with 1Q08’s 2,084 deals worth $182.9B billion, but down precipitously from the same period a year ago when 2,464 deals, worth a whopping $470.3 billion, were posted (Figure 18). Worldwide, 2Q08’s tally of 8,946 deals was in line with 2Q07, but the aggregate price tag fell 37% to $940 billion, according to Dealogic. The lack of private equity investment in 2Q08 was one key culprit for the year-over-year decline in dollars spent at home and abroad. Domestic and worldwide private-equity dollars spent fell 89% to $23.2 billion and 82% to $61.5 billion in 2Q08, respectively and also helped to push 2Q08 European dollars spent down year-over-year 59% to $274.4 billion. Asian activity, however, remained largely unaffected, posting a year-over-year 57% increase in 2Q08 dollars spent to $206.8 billion (excluding Japan).
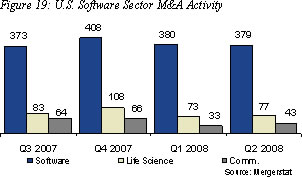
Software M&A Deal Volume and Spending
Software and IT services transactions remained healthy
in 2Q08, accounting for 19% of total U.S. deal volume,
up slightly from 18% in 1Q08 and from 15% for all of
2007. For the quarter, 379 software and IT services
businesses were acquired, down 7% from the 408 deals
posted in 2Q07, but in line with 1Q08’s 380 transactions
(Figure 19). The quarter’s 379 deals fetched $21.9
billion, slightly below the $25.5 billion and $25.4
billion spent in 1Q08 and 2Q07, respectively, but well
within historic norms (Figure 20). 2Q08 dollars spent
was buoyed by three mega deals worth $17.1 billion (78%
of total dollars spent), including Hewlett Packard’s
$14.4 billion (0.6x TTM revenue) offer for data
processing and outsourced services provider Electronic
Data Systems, Apax Partners’ $1.3 billion (2.8x TTM
revenue) leveraged buy-out of healthcare software
provider Trizetto Group and CCC Information Systems’
$1.4 billion offer for private equity owned Mitchell
International, a provider of information, workflow and
performance management software to the automotive
insurance claims industry (Appendix D). Comparatively,
there were seven mega deals in 1Q08 worth approximately
$14 billion (55% of total dollars spent) and seven mega
deals worth $18.6 billion (73% of total dollars spent)
the same quarter last year.
Small and mid-market software M&A activity (transactions with enterprise values less than $500 million)
continued to comprise the bulk of transactions, with buyers laser focused on highly strategic tuck-ins and
bolt-ons. Of the quarter’s 379 software mergers and acquisitions, 376 (99%) were small and mid-market
transactions that aggregated $4.8 billion. By comparison, there were 373 (98%) small and mid-cap
transactions worth $10.8 billion in 1Q08 and 401 (98%) transactions totaling $6.8 billion in 2Q07.
The average small and mid-cap transaction size was approximately $12.8 million in Q2, a significant decline
from the $28.8 million average in 1Q08 and $16.9 million average in 2Q07.
The takeaway: Software company buyers remained acquisitive in Q2, but pulled tightly on their purse strings.
It is important to note, however, the number of small- and mid-market transactions did not erode,
as buyers continue to innovate through acquisition.
Deal Currency
As in quarters past, cash only deals comprised the lion’s share of M&A deals in 2Q08, accounting for 73% of software M&A transactions, up slightly from 1Q08’s 70% (Figure 21). While the percentage of all-cash deals has fluctuated quarter-to-quarter (mostly inversely with the public markets), cash-only deals have grown in the past twelve months, while cash and stock and all-stock deals have slightly declined. Contributing factors are substantial amounts of cash on buyer
balance sheets, seller stock market pessimism, buyer
reluctance to use devalued stock as deal currency
and foreign acquirers taking advantage of the weak
dollar.
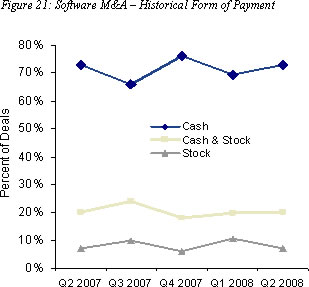
Assuming macroeconomic weakness persists, we expect a moderate increase in the percentage of all-cash deals through the latter half of 2008.
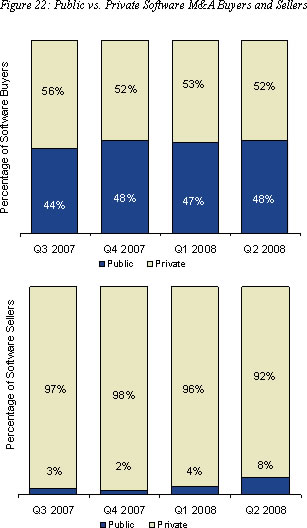
Private vs. Public Buyers
Private buyers accounted for 52% of
software M&A transactions in 2Q08, on par with 1Q08
(53%) and in line with the trend we noted last
quarter (Figure 22). Since the first half of 2007,
(when private buyers accounted for 58% of software
M&A acquirers) the percentage of private acquirers
has steadily declined, as private equity firms have
found it increasingly difficult to finance platform
and tuck-in acquisitions and private strategic
acquirers have opted to conserve cash and equity.
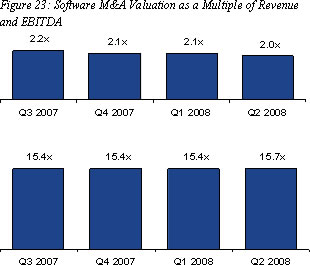
M&A Valuations
Software M&A valuations declined slightly in the
second quarter, due, in part, to undervalued public
companies being acquired. On a multiple of revenue
basis, the median enterprise value in 2Q08 was 2.0x
TTM revenue, slightly down from the 2.1x TTM
valuation we saw in 1Q08 and 2Q07. On a multiple of
EBITDA basis, the 2Q08 median was 15.7x TTM EBITDA,
a slight increase over the past several quarters
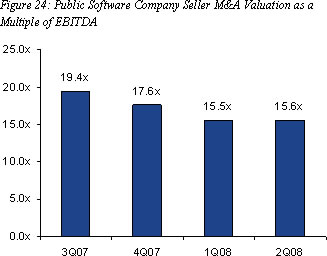
(Figure 23). Public companies garnered a modest
15.6x TTM EBITDA, up slightly from 1Q08’s 15.5x, but
still lagging the 19.4x and 17.6x TTM EBITDA valuations
commanded in 3Q07 and 4Q07, respectively
(Figure 24).
We attribute this to continued stock
market instability. Despite solid financial
performance, publicly traded software companies have
continued to see their stock prices erode, providing
value investment opportunities for both strategic
and financial acquirers.
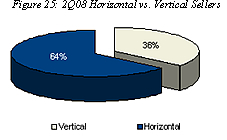
To provide additional granularity, we sliced the
median 2Q08 revenue valuation software M&A multiple
horizontally and vertically, segregating vertical
market software company sellers (e.g. retail,
financial services, telecom, manufacturing, etc.)
from sellers with horizontal software solutions
(infrastructure, enterprise applications, etc.)
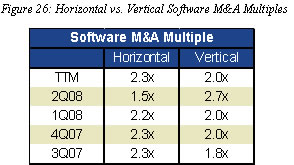
 In the second quarter, vertical market solution providers accounted for 36% (Figure 25) of all software M&A transactions and received a whopping 2.7x TTM revenue exit valuation (Figure 26), up from 2.1x in 2Q07 (the only other quarter in which vertical solution providers received greater valuations than their horizontal counterparts), while horizontal solution providers comprised 64% of sellers and commanded a median 1.5x TTM revenue valuation (2.0x in 2Q07). Vertical seller valuations were buoyed in the second quarter by a handful of financial public to private vertical transactions including Great Hill Partners acquisition of CAM Commerce ($151.4 million, 4.1x TTM revenue), Capita Group’s acquisition of IBS OPEN Systems ($115.8M, 2.8x TTM revenue), Apax Partner’s acquisition of The Trizetto Group ($1.3 billion, 2.8x TTM revenue)
and JMI Equity/The Carlyle Group’s acquisition of Gemcom
($139.4 million, 2.6x TTM revenue). Additionally, VC’s exited
several providers of vertical solutions for substantial multiples in
the second quarter, including CCC Information Services Group’s
acquisition of Mitchell Enterprises ($1.4 billion, 7.0x TTM revenue)
and FTI Consulting’s acquisition of Attenex ($88 million, 3.5x TTM
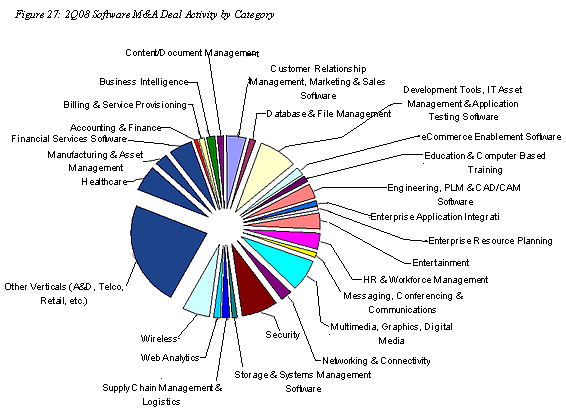
revenue). The healthcare, financial services, public sector and
legal industries were the most active software M&A verticals in
2Q08, accounting for 16%, 14%, 6% and 5%, respectively, of all
vertical transactions (Figure 27).
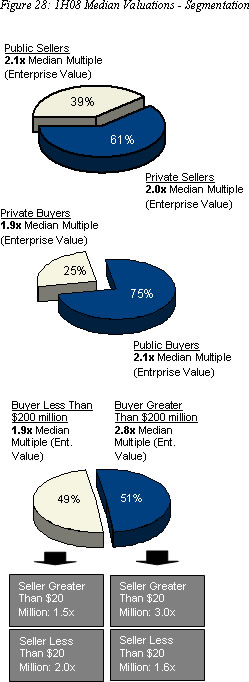
We’ve repeatedly demonstrated in prior SEG Quarterly Reports that three of the most important determinants of exit valuation are the seller’s equity structure, size and product category (Figures 28 & 29). We analyzed all M&A transactions over the last twelve months with ascertainable revenue multiples to determine the individual impact on valuation of equity structure (private vs. public company), size (revenue) of buyer and seller and the seller’s software product category.
As a first step, we sorted 1H08’s transactions by separating public and private software company ‘sellers’ to ascertain any difference in median exit valuation. In our 2007 Annual and 1Q08 reports, we noted that undervalued public sellers had been picked clean by strategic and financial acquirers, forcing buyers to pony up substantially greater sums of cash for financially healthier public targets. Consequently, public sellers commanded a median exit multiple of 3.0x TTM revenue in 2007 and 3.2x TTM revenue in 1Q08, while private sellers received a median 2.1x TTM revenue in 2007 and 2.0x TTM in 1Q08. In 2Q08, however, public company sellers received a modest 2.1x TTM revenue multiple, virtually the same as the median 2.0x TTM exit valuation paid their privately held counterparts. Why the retreat in median exit valuations for public sellers? First, falling stock prices have resulted in markedly lower valuations for many public software companies. Second, we were wrong in noting a dearth of undervalued, underperforming public software companies. Strategic acquirers found and scooped up several in Q2 including Kintera, acquired by BlackBaud’s (1.0x TTM revenue valuation, seller reporting 2.9% TTM revenue growth); NetManage, acquired by MicroFocus (1.2x TTM revenue valuation, seller reporting 7.1% TTM revenue growth); Iona Technologies, acquired by Progress Software (1.4x TTM revenue valuation, seller reporting 2.8% TTM revenue growth); and Insightful, purchased by Tibco (0.7x TTM revenue valuation, seller reporting -14.7% TTM revenue growth).
 As in prior quarters, there was a direct correlation in 2Q08 between public seller exit valuation and revenue growth rate. Public software company sellers that garnered better than 2.0x TTM revenue generated median TTM revenue growth of 15.9%. Conversely, public company sellers with an exit valuation less than 2.0x TTM revenue a median growth rate of 7.9%. Unsurprisingly, revenue growth continues to be a key determinant of a public software company’s exit valuation.
As a next step in our analysis, we separated public and private software company ‘buyers’ to ascertain any difference in median purchase price paid. In transactions where an exit valuation multiple was ascertainable, private buyers (both strategic and private equity), comprised 25% of all software company acquirers year-to-date and paid a median M&A price of 1.9x TTM. By contrast, public software companies comprised 75% of these transactions and paid a median purchase price of 2.1x TTM. Finally, we analyzed 1H08 exit valuations based upon the size (revenue) of buyer and seller. As in prior years, buyer size was a key determinant of exit valuation. Buyers with revenue greater than $200 million paid a median purchase price of 2.8x seller’s TTM revenue, while buyers with revenue less than $200 million paid median 1.9 x TTM revenue.
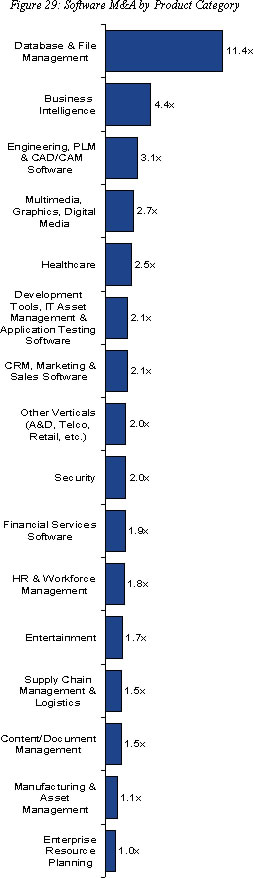
M&A Exit Valuations by Software Category
While size and software delivery model are key value drivers, software product category continued to be the single most important M&A valuation driver. Among the 16 product categories we track (Figure 30), database and file management software transactions led the pack, garnering a median 11.4x TTM revenue exit value - buoyed by 1Q08 acquisitions of BladeLogic ($811 million, 11.4x TTM revenue) and MySQL ($1 billion, 18.9x TTM revenue) by BMC and Sun Microsystems, respectively and HP’s acquisition of Opsware in 3Q07 $1.6 billion, 15.1x TTM revenue). Business Intelligence and Engineering, PLM and CAD/CAM software took a distant second and third, fetching median 4.4x and 3.1x TTM revenue exit valuation, respectively. Exit multiples for the remaining product categories ranged from 2.7x TTM for Multimedia, Graphics and Digital Media and 2.5x TTM for Healthcare (a very healthy median vertical multiple), to 1.0x TTM revenue for providers of Enterprise Resource Planning software.
SaaS
SaaS providers continued to be highly attractive acquisition candidates in the
second quarter and continued to extract a significant exit premium compared to
their perpetual license counterparts. SaaS transactions in 2Q08 continued to
extend beyond traditional CRM and workforce management categories to business
intelligence, content management, supply chain management, security, mobile
computing wireless networking and internet infrastructure. Vertical SaaS
providers were also popular, with the legal, healthcare and non-profit sectors
contributing to 2Q08 SaaS M&A activity. Representative transactions included
EPIQ System’s acquisition of legal e-discovery solutions provider PinPoint
Global and Blackbaud’s acquisition of struggling rival non-profit software
supplier Kintera. In the e-mail marketing space, GSI Commerce’s 1Q08 acquisition
of e-Dialogue for $167 million (4.9x TTM revenue) was followed by 2Q07
acquisitions of marketing automation providers nTarget, Starcite and GOT
Corporation. Appendix E lists other notable 1H08 SaaS transactions.
This report was prepared by Software Equity Group, L.L.C. (SEG), a
mergers and acquisitions advisory firm, which analyzes software industry public
company stock market performance, initial public offerings, mergers and
acquisitions as well as venture capital and private equity placements. SEG was
founded in 1992 and has represented and guided private companies throughout
North America, Europe, Asia Pacific, Africa and Israel. They represent some of
the world’s leading private equity firms and have advised public companies
listed on the NASDAQ, NYSE, American, Toronto, London and Euronext exchanges.
For more, please visit
www.softwareequity.com.
 

|
|


|


