|
|
| Home - Industry Article -
December 08 Issue |
Q3 2008 Software Industry Mergers and Acquisitions |
By Ken Bender, Managing Director and Kris Beible, Analyst, Software Equity Group, LLC
Figure 16: U.S. Merger & Acquisition Activity
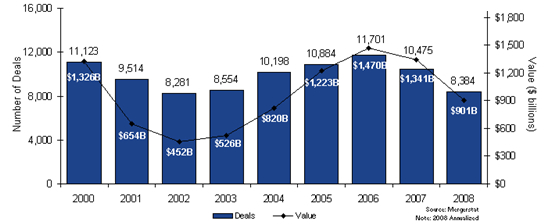
Mergers and Acquisitions: The Numbers
M&A Deal Volume and Spending: All Industry Sectors
After a four-year buying spree, acquirers predictably retreated as economic
conditions worsened and credit tightened. Across all industry sectors, aggregate
US deal volume and aggregate transaction value for 2008, annualized based upon
the first three quarters, are on track to decline 28% and 33%, respectively,
from 2007 (Figure 16).
In light of more recent, and more dire, events that have followed thus far in
October, 2008 M&A activity will slow further in Q4 due to extraordinarily tight
credit markets, a de facto recession and economic uncertainty so severe, even
opportunistic and cash-rich acquirers will take pause.
The sharp decline in deal volume and aggregate M&A spending is in no small part
attributable to the withdrawal of many private equity firms from the market due
to the scarcity of debt financing and much less attractive leverage multiples.
Globally, private equity buyout spending fell 49% in the third quarter – to
$53.6 billion from $105.5 billion the same period a year ago. According to
Dealogic, US private equity deal volume declined 25% year-over-year, from 196
deals in 3Q07 to 148 in 3Q08. US private equity spending fell to $27.9 billion
in 3Q08, a 50% decrease from the $55.5 billion spent in 3Q07. For transactions
over $1 billion, private equity spending in 3Q08 fell 50% to $20.7 billion from
$44 billion year-over-year. Dollars spent for transactions between $500 million
and $1billion posted the sharpest decline, falling 67% to $2.9 billion in 3Q08
from $8.7 billion in 3Q07. Private equity deals under $500 million were least
affected, but still posted a sharp 34% decline, falling to $4.8 billion from
$7.3 billion in 3Q07.
One reason why deal volume has declined much less than aggregate buyout spending
is that many PE firms, confronted with the absence of debt financing and
pressure to deploy their capital, moved down market. As a result, there has been
significant competition among private equity firms to fund buyouts in the $50
million to $500 million range. While the credit markets may thaw in the coming
months, prospective sellers in this valuation range should continue to benefit
from these market drivers.
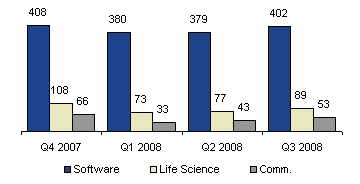
Software M&A Deal Volume and Spending
The US Software and IT services sector was the standout exception to the overall
decline in US M&A deal volume. Software and IT Services rallied in the third
quarter, posting 402 transactions (Figure 17), a 6% jump from 2Q08, and an 8%
increase over 3Q07. Software and IT services deals accounted for approximately
18% of total US deal volume 3Q08, down slightly from 19% in 2Q08, but still well
above 3Q07’s 15% share. The third quarter’s tally marks the first time in 2008
(but the 11th time in the last 14 quarters) deal volume has surpassed 400
transactions.
Figure 17: U.S. Software Sector M&A Activity
Ironically, the quarter’s software industry deal volume was likely boosted by
the current shortage of credit, market turmoil and a looming recession, as
larger software industry buyers with healthy balance sheets continued to be
acquisitive. Much like their private equity counterparts, strategic acquirers
opted to make less risky bets by continuing to acquire small and mid-cap
companies with solid recurring revenue, loyal customers and reasonable
valuations. Examples of these smaller, more strategic acquisitions include
McAfee’s purchase of enterprise gateway security software provider Secure
Computing ($485.2 million, 1.9x TTM revenue), JDA Software’s acquisition of I2
Technologies ($398.7 million, 1.6x TTM revenue), Hellman and Friedman’s
leveraged buy-out of SSP Holding ($393.6 million, 3.1x TTM revenue) and
Convergys’ acquisition of Intervoice ($269.6 million, 1.3x TTM revenue).
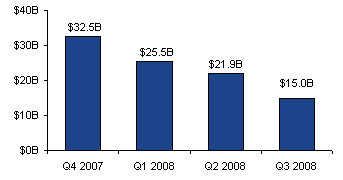
As for last quarter’s total M&A price tag, consideration for the 402 deals
aggregated $15 billion (Figure 18), up from 3Q07’s $12 billion, but down
markedly from 2Q08’s $21.9 billion total. 3Q08 marked the third consecutive
quarterly decline in dollars spent. With caution as the keynote, mega-deals
(transactions with enterprise values greater than $500 million) were
non-existent in 3Q08, compared to three mega-deals totaling approximately $17.1
billion in 2Q08, and seven mega-deals worth an approximate $14 billion in 1Q08.
If the three mega-deals are backed out of 2Q08’s $21.9 billion dollars spent,
average deal size actually increased from $13 million in 2Q08 to $37 million in
3Q08.
Figure 18: U.S. Software Sector M&A Dollars Spent
Should the US economy slip into a prolonged recession, software M&A deal volumes
and spending will both decline markedly, likely six to nine months later since
the software industry generally trails the general economy. As IT spending
declines and revenue growth stalls for many public software companies, most will
carefully scrutinize all capital investments – including proposed mergers and
acquisitions. This will likely impact mid-cap software buyers more than the
cash-rich elite (i.e., Oracle, Microsoft, SAP, IBM, Google, et. al.) who could
opportunistically target mid-cap, cash constrained software companies in their
cross hairs. Smaller privately-held software companies with innovative
technologies or highly complementary offerings that offer significant
sell-through potential will also be attractive targets.
Conversely, if the recession is short and shallow, IT spending resumes and the
debt markets recover in the next 12 to 18 months, which we consider unlikely, we
could very well see a resurgence of M&A activity due to pent up demand by
private equity acquirers. In such case, look for undervalued public mid-cap
software providers to be acquired first as PE firms establish new platforms,
followed by an array of complementary tuck-in acquisitions.
Deal Currency
Given the market’s current volatility, it was no surprise cash-only deals were
the principal form of deal consideration in 3Q08, comprising 75% of all software
M&A transactions, up slightly from 2Q08’s 73%, and up sharply from 3Q07’s 66% of
all deals (Figure 19). The growth of all-cash deals has come at the expense of
those buyers seeking to use stock as deal currency. All-stock deals declined
further to comprise only 4% of the quarter’s deal volume, while cash+stock
transactions have remained relatively flat. Several factors are at play here:
High amounts of cash on buyers’ balance sheets, stock market uncertainty and
buyer reluctance to use devalued stock as deal currency.
Figure 19: Software M&A Form of Payment

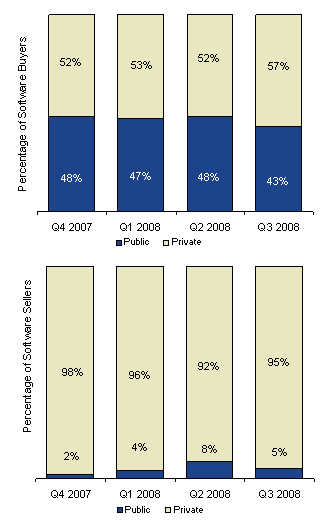
Private vs. Public Buyers
Public buyers accounted for 43% of all software M&A transactions in 3Q08 (Figure
20), down from 48% in 2Q08, but in line with 3Q07’s 44%, and 1H07’s 42%. Q3 saw
a notable increase in the number of private buyers, a phenomenon attributable to
several interesting factors: First, there were a plethora of relatively small,
private software companies buying even smaller software companies, sometimes for
purposes of consolidation and market share, but often for complementary
technologies and new markets. Second, Q3 saw an increase in the number of
private foreign companies acquiring US-based software companies. And finally,
private companies and private equity firms seeking new platform companies, made
a bit of a comeback in Q3. Private equity players have become far more flexible
of late, increasing their equity participation in many buyouts to compensate for
the reduced availability of debt financing and entertaining majority and even
minority investments.
Figure 20: Public vs. Private Software M&A Buyers and Sellers
M&A Valuations
Software M&A valuations slid in the third quarter, as public software company
buyers became more conservative and more mindful of their own markedly lower
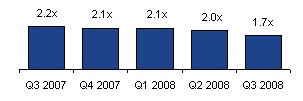
valuations in the public market. On a multiple of revenue basis, the median M&A
valuation in Q3 mirrored the public market valuation, falling to 1.7x TTM
revenue, a marked decline from the 2.0x TTM valuation we reported for 2Q08 and
2.2x TTM valuation witnessed in 3Q07 (Figure 21). Also contributing to the
decline in median exit valuation in Q3 were the many smaller, private buyers
with limited cash and a frugal mindset. There was insufficient publicly reported
data this quarter to ascertain enough private seller EBITDA multiples to derive
a median exit valuation on that basis, so we analyzed public seller EBITDA
multiples only (Figure 22).
Figure 21: Software M&A Valuation as a multiple of revenue (Quarterly)
Public software company sellers commanded a modest 15.5x TTM EBITDA, slightly
down from 2Q08’s 15.6x, but still lagging the 19.4x and 17.6x TTM EBITDA
valuations garnered in 3Q07 and 4Q07, respectively (Figure 22). Here again, the
median M&A valuation reflected the public market valuation, which fell from a
median EV/EBITDA of 17.5x and 17.8x in 3Q07 and 4Q07, respectively, to 12.8x in
3Q08.
Figure 22: Public Software Company Seller Valuation as a Multiple of EBITDA

Once again, we caution our readers about using median TTM revenue and EBITDA
deal multiples to assess the fair market or prospective exit valuation of a
particular software company. Examples abound of companies selling for modest
multiples in strong economies and eyebrow-raising multiples in tough economic
times. In every economy, the software company valuation range is wide and the
valuation drivers are many and varied.
 

|
|


|


