|
|
| Home - Industry Article -
December 08 Issue |
Q3 2008 Software Industry Mergers and Acquisitions |
continued... page 2
We’ve repeatedly demonstrated in prior SEG Quarterly Reports that three
of the most important determinants of exit valuation are the seller’s product
category, equity structure, and size (Figure 23). The axiom held true in 3Q08.
We analyzed all M&A transactions year-to-date with ascertainable revenue
multiples to determine the specific impacts on valuation of equity structure
(private vs. public company), size (revenue) of buyer and seller, and the
seller’s software product category.
Figure 23: YTD Median Valuations - Segmentation

As a first step, we sorted these TYD transactions by equity structure,
separating public from private software company sellers to ascertain any
difference in median exit valuation. Public company sellers received a
year-to-date median exit value of 2.1x TTM revenue, while private sellers posted
a slightly lower median valuation, 2.0x TTM revenue. Over the past several
quarters we’ve seen the once substantial exit valuation variance between public
and private sellers lessen, as public stock market valuations and price tags
moderate. We expect this trend to continue so long as stock market valuations
remain at or near current levels.
As a next step in our analysis, we separated public and private software company
buyers to ascertain any difference in median purchase price paid. Here too, the
historical variance diminished. In transactions where an exit valuation multiple
was ascertainable, private buyers (both strategic and private equity) paid a
median M&A purchase price of 1.9x TTM. By contrast, public software companies
paid a median purchase price of 2.1x TTM.
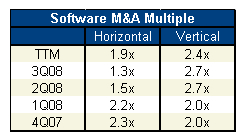
Additionally, we sliced the 3Q08 (not year-to-date) median software M&A multiple
horizontally and vertically, segregating vertical market software company
sellers (e.g. retail, financial services, telecom, manufacturing, etc.) from
sellers with horizontal software solutions (infrastructure, enterprise
applications, etc.). In 3Q08, providers of vertically-focused software
businesses accounted for 34% (Figure 24) of all software M&A transactions and
received an astounding median 2.7x TTM revenue (Figure 25) exit valuation, while
horizontal solution providers comprised 66% of sellers and received a dismal
1.3x TTM revenue valuation, a further decline from 2Q08’s already meager 1.5x
valuation. This is the second consecutive quarter we’ve observed this
phenomenon, which is in large part attributable to VCs cashing in vertical bets
placed several years ago. Notable vertical exits by VCs in 3Q08 included
Marketing Technology Solutions, sold to WebMD ($75 million, 3.6x TTM revenue);
and the sale of Clarix to Phase Forward ($40 million, 14.8x TTM revenue).
Hellman and Friedman’s leveraged buy-out of SSP Holdings ($394 million, 3.1x TTM
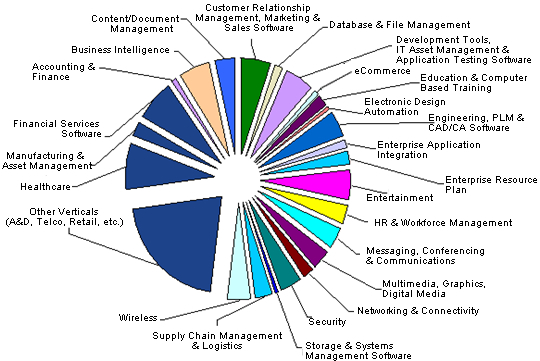
revenue) also helped to push up the median vertical valuation. Once again,
healthcare and financial services were the two most active software M&A
verticals in 3Q08, accounting for 22% and 20%, respectively, of all vertical
transactions (Figure 27).
Figure 24: 3Q08 Horizontal vs. Vertical Sellers

Figure 25: Horizontal vs. Vertical Software M&A Multiples
M&A Exit Valuations by Software Category
While company size and software delivery model demonstrably impact valuation,
software product category continued to be the single most important M&A
valuation driver. For most software product categories, there is often an
insufficient number of transactions that publicly report both seller TTM revenue
and buyer purchase price, essential data in ascertaining the applicable median
exit value for the product category. Consequently, we aggregate the data each
quarter on a TTM basis. As a result, it may take several quarters to detect
changing product category valuation trends and certain outlier transactions
consummated nine or twelve months ago may have a residual impact on their
product category multiples.
Among the 14 product categories we tracked in 3Q08 (Figure 26), business
intelligence led the pack, garnering a 4.4x TTM revenue median exit valuation.
The category continues to be buoyed by the 4Q07 acquisitions of Business Objects
($4.4 billion, 4.3x TTM revenue) by SAP and Cognos ($4.6 billion, 4.5x TTM
revenue) by IBM, as well as Microsoft’s 1Q08 purchase of Fast Search and
Transfer ($1.1 billion, 7.4x TTM revenue). As these fall off in the coming
quarters, we expect the BI median exit multiple to drop substantially.
Figure 26: Software M&A by Product Category
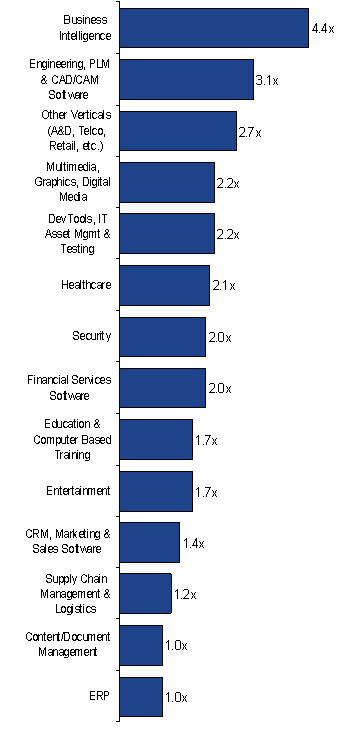
Engineering, PLM and CAD/CAM software followed second, posting a 3.1x TTM
revenue multiple. Transactions here were more recent and the product category’s
median exit multiple is consequently more reflective of the current market.
Deals in the category included Deltek’s 3Q08 purchase of Planview’s Micro-Frame
Program Management Division ($16 million, 3.2x TTM revenue), Autodesk’s 2Q08
acquisition of Moldflow ($190.1 million, 3.1x TTM revenue) and Synopsys’ 1Q08
acquisition of Synplicity ($215.8 million, 3.0x TTM revenue).
Vertical solution providers, which we aggregate into a single product category
for reporting purposes, received median exit valuation of 2.7x TTM revenue. The
category has steadily improved in valuation over the past year as a plethora of
VC-backed and public vertical software companies have been acquired at
impressive, and unprecedented, multiples. Exit valuations for the remaining
product categories ranged from 2.2x TTM revenue for providers of Multimedia,
Graphics and Digital Media solutions to 1.0x TTM revenue for Content and
Document Management and Enterprise Resource Management software.
Figure 27: Software M&A by Product Category
SaaS
SaaS providers remained highly attractive acquisition candidates in the third
quarter and continued to extract a significant exit premium compared to their
perpetual license counterparts. SaaS transactions in Q3 comprised a broad mix of
product category applications including workforce management, business
intelligence, supply chain management, security as well as legal and healthcare
applications.
Workforce management, which adopted the SaaS delivery model early on, added two
more SaaS transactions in 3Q08 including Monster’s acquisition of recruitment
and applicant tracking software provider Trovix ($73 million) and private equity
firm Bedford Funding’s acquisition of talent management software provider
Authoria ($63.1 million, 3.5x TTM revenue estimate). The SaaS project management
space has also seen recent activity including Serena Software’s 3Q08 acquisition
of Projity and NetSuite’s 2Q08 acquisition of OpenAir ($26 million), a provider
of both workforce and project management applications. Appendix E lists other
notable year-to-date SaaS transactions.
Please visit Software Equity Group LLC (SEG) to download a
complimentary copy of the full 3Q08 Software Industry Equity Report, which
analyzes software industry public company stock market performance, initial
public offerings, mergers and acquisitions, and venture capital and private
equity placements. The group is an investment bank and M&A advisory serving the
software and technology sectors. Founded in 1992, SEG has represented and guided
private companies throughout the United States and Canada, as well as Europe,
Asia Pacific, Africa and Israel, and has advised public companies listed on the
NASDAQ, NYSE, American, Toronto, London and Euronext exchanges. The group also
represents several of the world's leading private equity firms and was recently
ranked among the top ten investment banks worldwide for application software
mergers and acquisitions.
 

|
|


|


