|
|
| Home - Software M&A Review - Nov 06 Issue |
Software M&A – A Buoyed Q3 |
By Ken Bender and David Legacki, Software Equity Group, L.L.C.
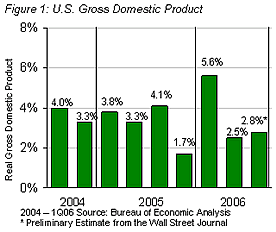
Despite a weakening housing market, a struggling domestic auto industry and surging energy prices which didn’t begin their sharp descent until the quarter’s close, the U.S. economy remained relatively healthy in the third quarter of 2006. Gross Domestic Product (GDP), a key economic indicator and broadest measure of economic activity, is projected to grow at an annualized rate of 2.8% in 3Q06, up from 2Q06’s GDP of 2.5%, but still markedly lower than 1Q06’s rate of 5.6% (Figure 1).
According to The Conference Board, five of ten leading economic indicators increased in July. The positive contributors – beginning with the most positive contributor were – average weekly manufacturing hours, vendor performance, stock prices, index of consumer expectations, and manufacturers’ new orders for consumer goods and materials. The negative contributors – beginning with the most negative were – building permits, average weekly initial claims for unemployment insurance (inverted), interest rate spread, manufacturers’ new orders for non-defense capital goods, and real money supply.
Other economy performance measures remained mostly positive. The Federal Reserve Rate was unchanged in 3Q06 after being raised 25 basis points to 5.25% in June 2006 (up from 3.75% at the end of 3Q05). According to the U.S. Department of Commerce, equipment and software spending, the GDP indicator with a significant IT component decreased 1.6% in 3Q06, a notable decline following 2Q06’s 15.6% increase. The number of unemployed (7.1 million) and the nation’s unemployment rate (4.7%) remained relatively unchanged from 2Q06 to 3Q06. The unemployment rate has been steadily decreasing for the past three years.
Looking ahead to the final quarter of the year, a midyear survey of 56 economists by The Wall Street Journal reports cautiously project a 2.6% GDP growth in 4Q06. The Conference Board’s index of leading economic indicators, which gauges the economy’s likely performance over the next three to six months, suggests slow to moderate growth for 4Q06.
Public Markets and Public Software & Internet Company Performance
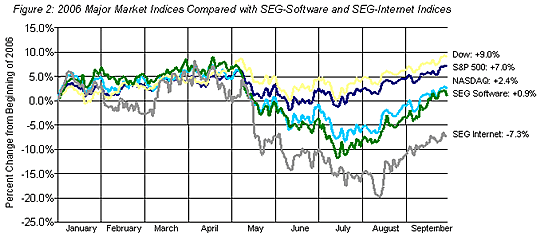
After a volatile first half, public markets rallied sharply in 3Q06 as investors focused on positive economic indicators and ignored or rationalized the negative. While the Dow didn’t reach its record high until shortly after the close of 3Q06, it did improve significantly, closing the quarter up 9.0% from its January opening. The S&P 500 and tech heavy NASDAQ, after ending 2Q06 with losses of 1.9% and 7.6%, respectively, regained their footing in 3Q06, posting end-of-quarter gains of 7.0% and 2.4%, respectively, over their January opening (Figure 2).
Public Software Company Performance
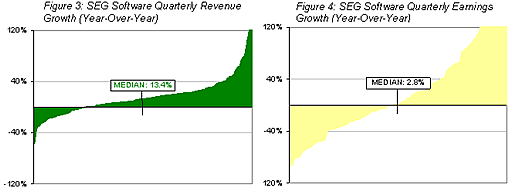
On a composite basis, public software company financial performance continued to improve in the second quarter, although investors appeared to value software companies more conservatively than quarters past. Median revenue of the 262 software companies comprising the SEG Software Index grew 13.4%, and median earnings grew 2.8%, over the same quarter a year ago (Figures 3 and 4).
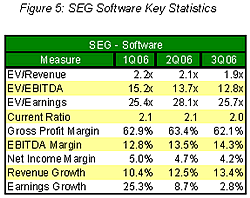
However, on a quarter-over-quarter basis, the median valuation of the public software companies comprising the SEG Software Index, expressed as a multiple of enterprise value to revenue, fell from 2.1x in 2Q06 to 1.9x in 3Q06. Other key financial performance measures for the SEG Software Index are enumerated in Figure 5.
As in past quarters, public software company financial performance in 3Q06 varied widely by software product category (Figure 6).
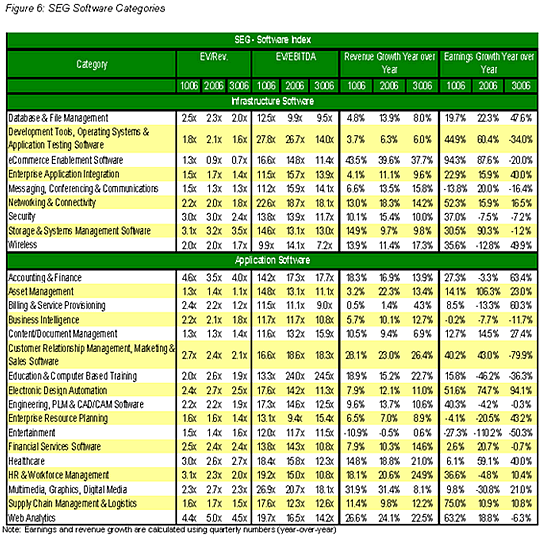
Relative to 3Q05, providers of eCommerce enablement software (Art Technology Group, Cybersource, Immergent, Optimal Group, et al.) and customer relationship management software led all other software categories in 3Q06 revenue growth (+37.7% and +26.4%, respectively), while software companies providing solutions for entertainment (+0.6%), billing & service provisioning (+4.3%) and development tools, operating systems and application testing software (+6.0%) continued to lag far behind. As for earnings, vendors of electronic design automation software led all other categories, reporting a median 3Q06 earnings increase of 94.1% over 3Q05, while customer relationship management companies declined 79.9% in median earnings over the same time period.
Investors continue to demand top-line growth of public software companies, particularly from new licenses and/or subscriptions. At the same time, and more so than ever, investors are clamoring for sustained, quarter-over-quarter increases in earnings and profitability, with special emphasis on EBITDA and free cash flow. Public software companies that fail to both grow revenue and generate significant free cash flow and EBITDA returns should see little if any increase in valuation in the coming quarters. Those that exceed expectations can expect to be rewarded. In fact, 3Q06 illustrates this well: the median EV/Revenue multiple for SEG Software Index companies posting a profit in 3Q06 was 2.3x, but only 1.2x for those reporting losses.
|
|


|

